Genotyping of Single Nucleotide Polymorphisms by Minisequencing Using Tag Arrays
I. INTRODUCTIONAn alteration of one nucleotide in a DNA sequence gives different phenotypic outcomes depending on its genomic location. Genomic nucleotide substitutions present in more than 1% of a population are denoted single nucleotide polymorphisms (SNPs). SNPs in protein-coding regions may alter the amino acid sequence of a protein, introduce stop codons, or produce new alternative splice sites in mRNA, thereby affecting the structure and function of the protein. SNPs located in the regulatory regions of a gene may alter binding sites for transcription factors and subsequently the expression level of the gene. The consequences of SNPs located in noncoding regions of the genome still remain largely unknown, but with the increasing interest in the function of noncoding RNA (Mattick and Gagen, 2001), their impact may soon become unravelled.
Following the completion of the draft sequence of the human genome (Lander et al., 2001; Venter et al., 2001), as well as of an increasing number of other genomes, the need for large-scale and high-throughput methods has increased. A promising and today widely used approach is the microarray format, which allows highly multiplex analysis of DNA, RNA, and proteins. This article describes the use of microarrays of immobilised oligonucleotides for SNP genotyping. Most SNP genotyping methods used today still depend on amplification of the region to be interrogated by the polymerase chain reaction (PCR) to provide the required sensitivity and specificity. Even though PCR was the technique that first enabled effective SNP genotyping, it is now the major factor limiting the high throughput of the methods due to the difficulties of designing robust multiplex PCR (Shuber et al., 1995).
Significant advantages of performing assays in the microarray format are the reduced genotyping costs due to the simultaneous analysis of many SNPs in each sample and the small reaction volumes employed. Three major reaction principles are currently used for SNP genotyping on microarrays; hybridisation with allele-specific oligonucleotide probes, oligonucleotide ligation, and DNA polymerase-assisted primer extension (for a review on genotyping techniques, Syvanen, 2001). Due to their high specificity, the enzymeassisted methods are gaining acceptance as the reaction principle of choice for multiplex SNP detection.
In the minisequencing reaction, a DNA polymerase is used to extend detection primers that anneal immediately adjacent and upstream of the sites of the SNPs. The primers are extended with differently labelled nucleotide analogues that are complementary to the nucleotides at the SNP sites. The method was initially devised with microtiter plates as the solid-phase support and has later been adapted to multiple assay formats (Syvanen, 1999), including microarrays with detection primers covalently attached to the microarray (Kurg et al., 2000; Lindroos et al., 2001; Pastinen et al., 1997).
II. PRINCIPLE OF THE METHOD
A flexible alternative minisequencing system is based on generic oligonucleotides ("cTags") immobilised on the microarray instead of specific detection primers. Cyclic minisequencing reactions with fluorescently labelled dideoxynucleotides (ddNTPs) are performed in solution using detection primers with 5' tag sequences complementary to one of the cTags included in the array. Each SNP is then interrogated by hybridizing the extended detection primers to their corresponding cTags with known locations in the array and the genotypes are deduced (Fig. 1A). The concept of using tagged PCR primers was first described for analysis of gene expression in yeast by PCR (Shoemaker et al., 1996) and was later been applied to SNP genotyping by primer extension and capture on fluorescent microparticles (Cai et al., 2000), highdensity oligonucleotide arrays [Affymetrix, GenFlex arrays (Fan et al., 2000)], and medium-density, custommade oligonucleotide arrays in different formats (Hirschhorn et al., 2000; Lindroos et al., 2002).
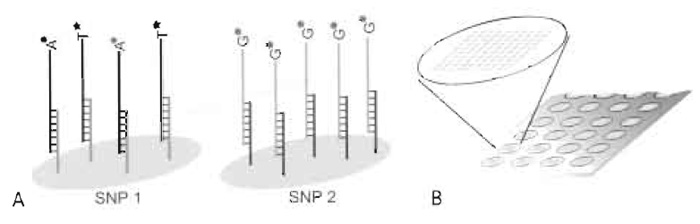 |
| FIGURE 1 Schematic illustration of the microarray result for an individual that is heterozygote (A/T) for SNP 1 and homozygote (G/G) for SNP 2. The SNPs have been interrogated by hybridizing detection primers with 5' tag sequences, extended with fluorescently labelled ddNTPs, to their complementary immobilised cTags (A). The format is an "array of arrays" with identical subarrays, allowing 80 samples to be analysed simultaneously for up to 200 SNPs on the same microscope slide (B). |
The format presented here uses an "array of arrays" formed by a silicon rubber grid (Pastinen et al., 2000) giving separate reaction chambers, each covering a subarray, that allow 80 samples to be analysed simultaneously for up to 200 SNPs on the same microscope slide (Fig. 1B). In contrast to the conventionally used format for mRNA expression, where a large number of genes are analysed in a relatively low number of samples, the "array of arrays" format allows for a large number of samples to be analysed simultaneously for an intermediate number of SNPs. The main steps of the assay are illustrated in Fig. 2.
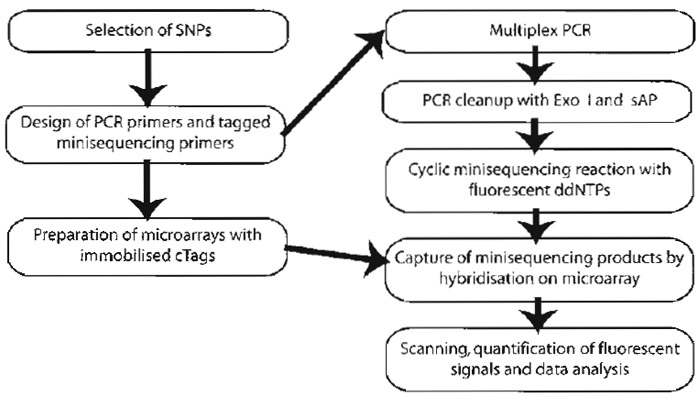 |
| FIGURE 2 Steps of the procedure for genotyping of SNPs by minisequencing using tag arrays. |
III. MATERIALS AND INSTRUMENTATION
The microarray slides are CodeLink-activated slides (reference number 25-6700-01) from Amersham Biosciences. The oligonucleotides are synthesized by Integrated DNA Technologies, and the tag sequences are obtained from Affymetrix. Elastosil (RT601) A (Cat.No. 60003804) and B (Cat.No. 60003815) are from Wacker- Chemie GmbH. In the multiplex PCR AmpliTaq Gold DNA polymerase, 5 U/µl, and GeneAmp 10x PCR gold buffer [100mM Tris-HCl, pH 8.3, 500mM KCl, 15mM MgCl2, and 0.01% (w/v gelatin)] (Part.No. N808-0245) from Applied Biosystems are used together with 10mM dNTPs (Cat.No. 10297-018) from Invitrogen Life Technologies.
Exonuclease I (Ref.No. E70073Z), 10 U/µl, shrimp alkaline phosphatase (Ref.No. E70072Z), 1U/µl, and ThermoSequenase (Ref.No. E79000Y), 32U/µl, are from Amersham Biosciences. The fluorescent dideoxynucleotides used are Texas red-ddATP 85,000M-1 cm-1 (Prod.No. NEL 411), TAMRA-ddCTP 91,000M-1 cm-1 (Prod.No. NEL 473), R110-ddGTP 78,000M-1 cm-1 (Prod. No. NEL 495), and Cy5-ddUTP 250,000M-1 cm-1 (Prod. No. NEL 589), all from PerkinElmer Life Sciences. Reagents of the highest purity grade from various sources are used for preparation of buffers and other solutions.
A ProSys 5510A instrument from Cartesian Technologies Inc., with four Stealth Micro Spotting Pins (Cat.No. SMP3), from TeleChem International Inc., are used for microarray printing. A Tetrad programmable thermal controller from MJ Research is used for thermo cycling. For scanning of arrays, a ScanArray 5000 instrument from PerkinElmer Life Sciences is used. Additionally, a centrifuge, an incubation oven, a heat block at 42°C, and optimally a multichannel pipette and a pipetting robot are needed. For all instrumentation, other equivalent equipment could be used equally well.
IV. PROCEDURES
A. SNP Selection
SNPs can be identified either experimentally or in databases. Database searches may be aimed at genes of interest, candidate chromosomal regions, or randomly distributed SNPs with known allele frequencies (Table I).
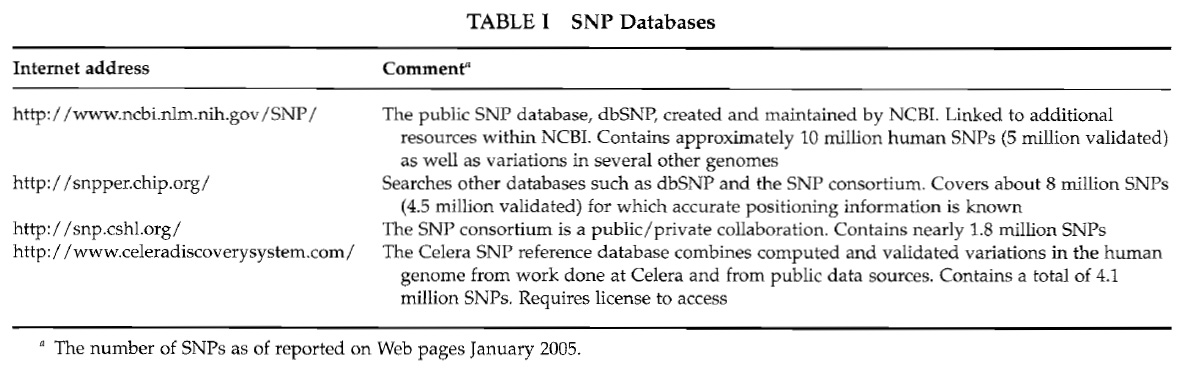 |
Be aware that many of the SNPs are not validated and that the fraction of "real" SNPs in the databases is still unknown. Validation may be done in a particular population by analysing pooled DNA samples using quantitative minisequencing in microtiter plates or directly on the microarray as has been described (Lindroos et al., 2002).
B. Primer Design
Design PCR primers flanking the SNPs of interest using available software. Primer 3, http://www. genome.wi.mit, edu/cgi-bin/primer/primer3_www.cgi, is freely available online or commercial software such as OLIGO: http://www.oligo.net/ can be purchased. The sequence of each PCR product should be "blasted" against the genome sequence (http://www.ncbi.nlm.nih.gov/BLAST/) and give a single hit only to the intended region.
Minisequencing primers anneal immediately adjacent and upstream of the SNP position. Minisequencing primers from both forward and reverse strands are helpful as internal controls for the genotyping results. Design the minisequencing primers to have a specific length of 18-22bp and to have a common melting temperature of 55-60°C to ensure specificity in the cyclic primer extension reaction. At the 5' end of the primer add the tag sequences, complementary to the cTags, that will be spotted onto the microarray. The tags should be 20bp long, have similar melting temperature, and not be complementary to either each other or the human genome. The Affymetrix GeneChip tag collection can be used as source for tag sequences. The complementary tag sequences (cTags) should have 15T residues as a spacer located 3' of the specific sequence and a final 3'-amino group to enable covalent attachment of the cTags to the slides.
To avoid strong hairpin-loop structures, evaluate the final minisequencing primer, including the tag sequence, with primer design software that predicts secondary structures (mfold: http://www.bioinfo. rpi.edu/applications/mfold/old/dna/ or NetPrimer http://www.premierbiosoft.com/netprimer/netprimer.html). Secondary structures that involve the 3' end of a primer may lead to misincorporation of nucleotides.
C. Microarray Preparation
Solutions
- 2× print buffer: 300mM phosphate buffer, pH 8.5. Store at room temperature up to 1 month.
- Oligonucleotides: Dissolve the cTags in 1× print buffer and dilute with dH2O to a final concentration of 25µM. Store at -20°C but limit freeze-thaw cycles.
- 1M Tris-HCl, pH 9.0: Dissolve 121.1g Tris in 800ml H2O, adjust the pH to 9.0 with HCl, and adjust to a total volume of 1 litre.
- Blocking solution: 50mM ethanolamine, 100mM Tris-HCl, pH 9.0, and 0.1% SDS. Prepare directly before use and preheat to 50°C. To make 500ml, use 1.6g ethanolamine, 50ml 1M Tris-HCl, 5ml 10% SDS, and add water to 500ml. Take care that the ethanolamine is highly corrosive and should be handled according to safety instructions.
- 20×SSC: 3M NaCl and 300mM sodium citrate, pH 7.0. Dissolve 175.3 g NaCl and 88.2 g sodium citrate in 800ml H2O. Adjust the pH to 7.0 with NaOH and adjust the volume to 1 litre. Autoclave and store at room temperature.
- 10% SDS: 10% (w/v) sodium dodecyl sulphate. Dissolve 100g of SDS in 900ml H2O. Adjust the pH to 7.2 with HCl and adjust the volume to 1 litre. Store at room temperature.
- Washing solution: 4xSSC and 0.1% SDS preheated to 50°C.
Prepare the arrays by contact printing the cTag oligonucleotides on CodeLink-activated slides (previously 3DLink slides). This may be done using a ProSys 5510A instrument with SMP3 pins that delivers i nl of the cTag solution to the slides as spots with a diameter of 125-150µm and with a center-to-center distance of, for example, 200µM. For the possibility of using the "array of arrays" format, print spots in a subarray pattern of either a 384- or 96-well format (see Fig. 1). Mark the position of some subarrays on the back side of the slides using a diamond pen.
Postprocess the slides according to the instructions of the manufacturer. The following protocol for CodeLink-activated slides is given.
Steps
- Prepare a saturated NaCl chamber with 75% relative humidity. In the bottom of a plastic container with an airtight lid, add as much solid NaCl to water as needed to form a 1-cm-deep slurry.
- After printing, keep the arrays in the NaCl chamber between 4 and 72h.
- Deactivate the excess of amine-reactive groups by immersing the slides for 15 min in the blocking solution at 50°C.
- Wash with dH2O, washing solution at 50°C for 15-60min, and dH2O subsequently.
- Spin dry the slides for 5 min at 900rpm. Store the slides desiccated at 20°C until use.
A fluorescently labelled cTag may be included in the array as a spotting control. For each batch of printed slides it is useful to analyse a few subarrays by hybridisation as quality control of the spots. After deactivation of the slides, hybridize a 3'-fluorescently labelled oligonucleotide designed to hybridize to all cTags (5'- AAA AAA AAA ANN NNN NNN NN-3') to some subarrays at 300nM concentration in 6xSSC for 10min with subsequent washing and scanning as described.
 |
| FIGURE 3 The arrayed slide is covered with a silicon rubber grid to give separate reaction chambers and is placed in a custom-made heat -conductive aluminium rack. A Plexiglas cover with a drilled hole through which the reaction chambers are accessed is tightly screwed on top the assembly, thus securing the silicon grid position during hybridisation. |
D. Preparation of Silicon Rubber Grid
Miniaturized silicon rubber (polydimethyl siloxan) reaction chambers are made using inverted microtiter plates with V-shaped wells as mould (Fig. 3).
Steps
- Mix the two Elastosil RT 601 components in a 50-ml Falcon tube in a mass ratio of 9:1, i.e., 46.8 g of A and 5.2 g of B for 30min (Elastosil RT625 may be used instead of RT601, thus giving a slightly softer silicon rubber).
- Pour the mixture onto an inverted 384-well microtiter plate, leaving about 1-2 mm of the tip of the wells uncovered. Allow to harden overnight at room temperature.
- Remove the silicon from the plate and use a scalpel to cut the silicon rubber into pieces of the size of microscope slides with the wells matching the printed subarrays.
The silicon is reusable, wash it with water and allow it to dry after each use.
E. Multiplex PCR
Primers for multiplex PCR should have as similar melting temperature and G/C content as possible. Different design programs, see earlier discussion, may be used to minimize primer-primer interactions. Complementary 3' sequences in the primers can be avoided by designing primers with the same 3' terminal nucleotides. Another possibility is the introduction of common tails on the 5' ends of all PCR primers and subsequent amplification with one common primer for all the fragments at an elevated temperature (Brownie et al., 1997). An example of a protocol with the common tail approach that has been used for a 20-plex PCR reaction in 384-well format in our laboratory is given.
Primers with common tails for multiplex PCR should have 18-25bp of specific sequence, have Tm 60-65°C, and give fragments about 100-200bp long. On the 5' end of both primers include a 26-bp-long common tail with Tm ~80°C (5'-GCG TAC TAG CGT ACC ACG TGT CGA CT-3'). In the PCR mixture use the tailed primers at 5 to 20nM concentrations, depending on priming efficiency (trial and error), and use the primer complementary to the tail at 1µM. Amplify the genomic DNA using 1 ng/µl DNA, 0.04 U/µl AmpliTaq Gold DNA polymerase, and 200µM of dNTPs in 4mM MgCl2, 10mM Tris-HCl, pH 8.3, 50mM KCl, and 0.001% (w/v) gelatin and the primers as described earlier in a final volume of 10µl. Amplify at 94°C for 5 min followed by four cycles of 94°C 60°C and 72°C for 1 min each. Then do 35 cycles of 94°C for 1 min and 74°C for 2 minutes and finally do an extension at 72°C for 10min. The success of the reactions may be verified on a 1% agarose gel for a subset of the samples.
F. PCR Cleanup
Solutions
- MgCl2 (50mM): To make a 1M stock solution, dissolve 203.3 g MgCl3·6H2O in 800ml of H2O and adjust the volume to 1 litre. Autoclave and store at room temperature.
- Tris-HCl, pH 9.5: Dissolve 121.1 g Tris in 800ml H2O, adjust the pH to 9.5 with HCl, and adjust to a total volume of 1 litre.
- Enzymes: Keep the ExoI and sAP enzymes on ice during handling and store at -20°C.
Steps
- For each sample, pool all multiplex PCR products.
- Prepare a master mix of the PCR cleanup reagents (Table II).
- To 7 µl of the pool, add 3.5 µl of the cleanup mixture to a total volume of 10.5 µl.
- Incubate at 37°C for 30-60min and inactivate the enzymes by heating to 95°C for 15 min.
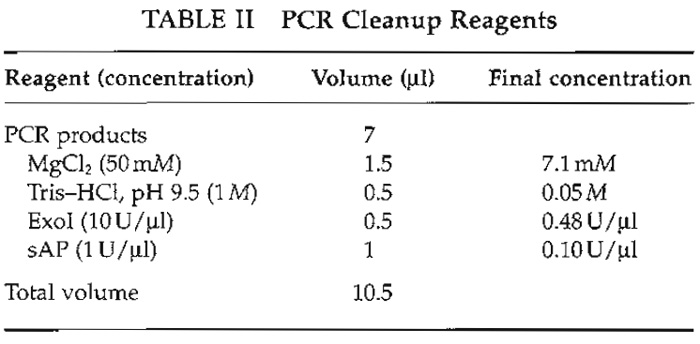 |
Alkaline phosphatase (sAP) inactivates the remaining dNTPs and exonuclease I (ExoI) degrades the single-stranded PCR primers, thus limiting extension of them in the subsequent minisequencing reaction. Include negative PCR controls at this step.
G. Cyclic Minisequencing
Solutions
- Triton X-100 (0.5%, v/v): Store at room temperature for up to 1 month.
- Tris-HCl, pH 9.5 (500mM): Dilute from 1M Tris-HCl, pH 9.5.
- ThermoSequenase: Keep on ice during handling, store at -20°C. Dilute the enzyme to required concentration directly prior to use.
- Fluorescent ddNTPs: Keep light-protected aliquots in 4°C and store stock solutions at -20°C.
Steps
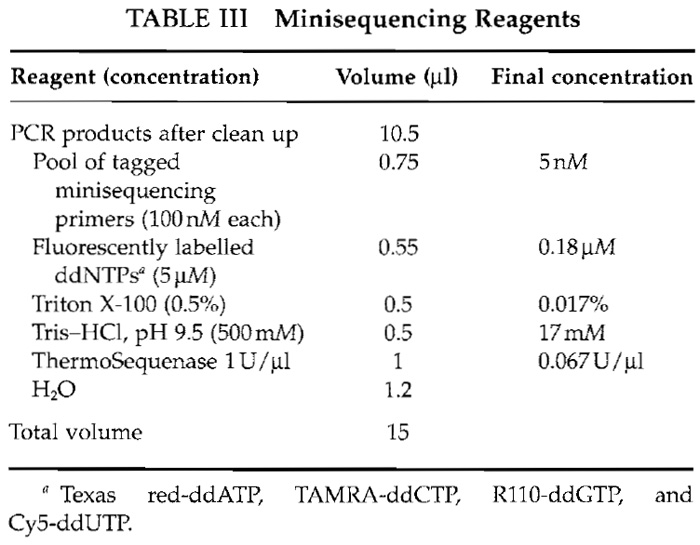
- Prepare a master mix of the minisequencing reaction reagents (Table III).
- After the cleanup step, add 4.5 µl of minisequencing reaction mixture to give a total volume of 15 µl.
- Perform the minisequencing reaction using an initial 3 min at 95°C followed by 33 to 99 cycles of 20 s at 95°C and 20 s of 55°C in a thermocycler.
 |
Additionally, an internal reaction control should be used. For that purpose, four synthesized singlestranded oligonucleotide templates differing only in one position mimicking the four possible alleles of a SNP are useful. Add the control template to the minisequencing reaction at a final concentration of 1.5nM. A complementary-tagged minisequencing primer should be included with the other minisequencing primers and its cTag should be included in the array. Because fluorophores are light sensitive, protect all reaction mixtures containing fluorophores from light.
H. Capture by Hybridization
Solutions
- 20×SSC: See Section IV, C.
- Hybridisation control: Oligonucleotide labelled with, for example, TAMRA, that hybridises to a corresponding cTag included in the array. Keep light-protected aliquots at 4°C and store stock solutions at -20°C.
Steps
- Position a silicon rubber grid over the arrayed slide with the aid of the diamond pen markings (see Fig. 3). Place the arrayed slides into the custom-made aluminium reaction rack and tighten the Plexiglas cover. Preheat the assembly on the side of a heat block to 42°C.
- To the products from the minisequencing step, add 6.85µl 20xSSC and 0.15µl hybridisation control oligonucleotide at 45nM concentration.
- Transfer 20µl of each sample to a separate reaction chamber on the microscope slide. A multichannel pipette is feasible for this step.
- Hybridize for 2.5-3h at 42°C in a humid environment accomplished, for example, by placing a wet tissue on the Plexiglas lid and cover it with plastic film and aluminium foil.
I. Washing
Solutions
- 4×SSC: Dilute from 20xSSC and store at room temperature
- 2×SSC, 0.1% SDS: Store at room temperature. Before use, preheat to 42°C.
- 0.2×SSC: Dilute from 20xSSC and store at room temperature.
Steps
- After hybridization, take the slides from the reaction rack and rinse briefly with 4xSSCat 20-25°C.
- Wash the slides twice for 5min with 2xSSCand 0.1% SDS preheated to 42°C and twice for 1min with 0.2xSSC at 20-25°C in 50-ml falcon tubes.
- Finally, spin dry the slides for 5 min at 900rpm and store them protected from light.
J. Scanning
If allowed by the scanner used, balance the signal intensity from each laser channel so that no signals are saturated and the signals from the four fluorophores are equally strong. Balancing is easy if a reaction control with signals from all four fluorophores is included on the array, as described earlier. An example of a scanning result is given in Fig. 4.
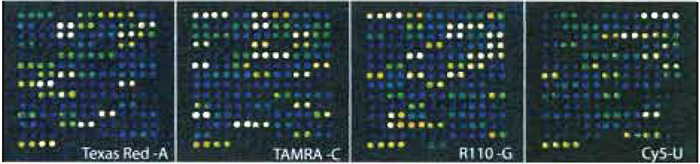 |
| FIGURE 4 Scanning results for 45 SNPs in one subarray, i.e., one sample, after cyclic minisequencing with ddATP, ddGTP, and ddUTP labelled with Texas red, TAMRA, R110, and Cy5, respectively. Each cTag was spotted as horizontal duplicates, and both strands of all SNPs were analysed. |
K. Data Analysis
A quantification program such as QuantArray handles the scanning images and quantitates the signals from each spot. Raw data are collected as an Excel sheet. From the signals from each channel, subtract the background measured either around the spots or at negative control spots, i.e., spotted cTags without corresponding tagged primers. Assign the genotypes of the SNPs in each sample by calculating the ratios between the signals from one of the alleles and the sum of the signals from both the alleles: signalAllele 1/ (signalAllele 1 + signalAllele 2)" A scatter plot with this ratio on the X axis and the sum of the signals from both alleles on the Y axis is used for assigning the genotypes (Fig. 5). This scatter plot should give three distinct clusters with the homozygote samples clustering at each side and the heterozygotes in the middle. The ratios may vary between SNPs depending on the sequence surrounding it, the type of nucleotide incorporated, and the light intensity of the fluorophores.
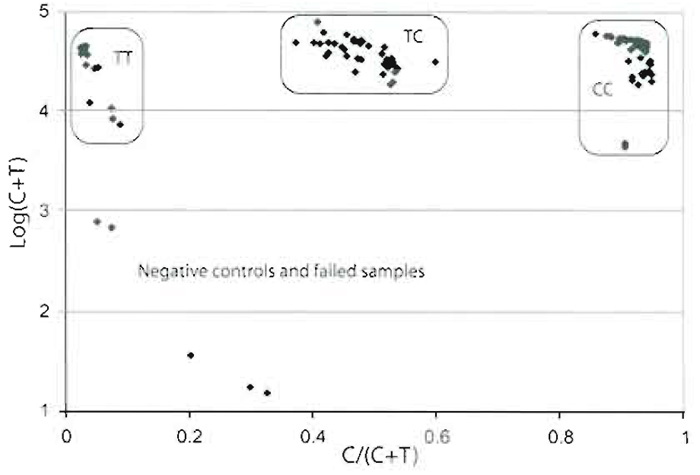 |
| FIGURE 5 Scatter plot for one SNP with a C/T variation in 56 samples. The logarithm of the sum of the fluorescent signal from both alleles. C + T, on the Y axis has been plotted against the ratio, C/(C + T), on the X axix. The three distinct clusters represent the three different genotypes, where two negative controls and three failed samples fall outside the clusters. |
V. PITFALLS
- Hairpin and loop secondary structures in the primers can give rise to false signals. Some primers may occasionally fail to give signals, probably due to secondary structures either in the primer itself or in the PCR template.
- Cy5-ddUTP can be used in higher concentrations than the other ddNTPs to compensate for its lower incorporation efficiency.
- Insufficient amounts of the PCR products resulting in low signals may be compensated for by increasing the amount of cycles in the minisequencing step.
- All solutions containing fluorophores are light sensitive and so are the slides after hybridization. To avoid bleaching, cover all reaction tubes and slides with aluminium foil.
- Background problems can arise if the hybridisation chamber is not kept humid and the sample dries out on the slide.
- If the Plexiglas cover is not tightened enough or if the silicon-rubber grid is damaged, leakage between reaction wells may occur. This can be controlled for by using differentially labelled hybridisation controls in adjacent reaction wells.
VI. COMMENTS
Depending on the available laboratory facilities or specific requirements of a project, this technique may be altered. Instead of multiplex PCR, single fragment PCR can be used with subsequent pooling of the amplified fragments, possibly after concentration using ethanol precipitation or spin dialysis. Different slides and attachment chemistries for the oligonucleotides have been tested, and new ones are continuously being developed (Lindroos et al., 2001). Depending on the number of SNPs to be interrogated, an inverted 96-well microtiter plate may be used as well for as silicon rubber mould to allow larger subarrays. When using the QuantArray program for signal analysing, the genotyping results can be visualised using the SNPSnapper software that has been custom made for this method (http://www.bioinfo.helsinki. fi/snpsnapper). Instead of using four differently labelled nucleotides in the same reaction, depending on the available microarray scanner, a single label or two labels may be used in four or two separate reactions, respectively (Liljedahl et al., 2003). It has been shown that the method described is quantitative and well suited to determine allele frequencies of SNPs in pooled DNA samples and is therefore a useful tool for rapid SNP validation (Lindroos et al., 2002).
References
Brownie, J., Shawcross, S., Theaker, J., Whitcombe, D., Ferrie, R., Newton, C., and Little, S. (1997). The elimination of primer-dimer accumulation in PCR. Nucleic Acids Res. 25, 3235-3241.
Cai, H., White, R S., Torney, D., Deshpande, A., Wang, Z., Marrone, B., and Nolan, J. P. (2000). Flow cytometry-based minisequencing: A new platform for high-throughput single-nucleotide polymorphism scoring. Genomics 66, 135-143.
Fan, J. B., et al. (2000). Parallel genotyping of human SNPs using generic high-density oligonucleotide tag arrays. Genome Res. 10, 853-860.
Hirschhorn, J. N., et at. (2000). SBE-TAGS: An array-based method for efficient single-nucleotide polymorphism genotyping. Proc. Natl. Acad. Sci. USA 97, 12164-12169.
Kurg, A., Tonisson, N., Georgiou, I., Shumaker, J., Tollett, J., and Metspalu, A. (2000). Arrayed primer extension: Solid-phase fourcolor DNA resequencing and mutation detection technology. Genet. Test. 4, 1-7.
Lander, E. S., et al. (2001). Initial sequencing and analysis of the human genome. Nature 409, 860-921.
Liljedahl, U., et al. (2003). A microarray minisequencing system for pharmacogenetic profiling of antihypertensive drug response. Pharmacogenetics 13, 7-17.
Lindroos, K., Liljedahl, U., Raitio, M., and Syvanen, A. C. (2001). Minisequencing on oligonucleotide microarrays: Comparison of immobilisation chemistries. Nucleic Acids Res. 29, E69-69.
Lindroos, K., Sigurdsson, S., Johansson, K., Ronnblom, L., and Syvanen, A. C. (2002). Multiplex SNP genotyping in pooled DNA samples by a four-colour microarray system. Nucleic Acids Res. 30, e70.
Mattick, J. S., and Gagen, M. J. (2001). The evolution of controlled multitasked gene networks: The role of introns and other noncoding RNAs in the development of complex organisms. Mol. Biol. Evol. 18, 1611-1630.
Pastinen, T., Kurg, A., Metspalu, A., Peltonen, L., and Syvanen, A. C. (1997). Minisequencing: A specific tool for DNA analysis and diagnostics on oligonucleotide arrays. Genome Res. 7, 606-614.
Pastinen, T., Raitio, M., Lindroos, K., Tainola, P., Peltonen, L., and Syvanen, A. C. (2000). A system for specific, high-throughput genotyping by allele-specific primer extension on microarrays. Genome Res. 10, 1031-1042.
Shoemaker, D. D., Lashkari, D. A., Morris, D., Mittmann, M., and Davis, R. W. (1996). Quantitative phenotypic analysis of yeast deletion mutants using a highly parallel molecular bar-coding strategy. Nature Genet. 14, 450-456.
Shuber, A. P., Grondin, V. J., and Klinger, K. W. (1995). A simplified procedure for developing multiplex PCRs. Genome Res. 5, 488-493.
Syvanen, A. C. (1999). From gels to chips: "minisequencing" primer extension for analysis of point mutations and single nucleotide polymorphisms. Hum. Mutat. 13, 1-10.
Syvanen, A. C. (2001). Accessing genetic variation: Genotyping single nucleotide polymorphisms. Nature Rev. Genet. 2, 930- 942.
Venter, J. C., et al. (2001). The sequence of the human genome. Science 291, 1304-1351.
Support our developers


