In vitro Motility Assays with Actin
I. INTRODUCTIONThe interaction between actin and myosin has been studied for years using a variety of techniques, including ultracentrifugation, light scattering, chemical cross-linking, fluorescence, and measurement of the effect of actin on the MgATPase activity of myosin. The sliding actin in vitro motility assay constitutes a relatively recent technique for studying actin-myosin interaction. This assay, developed by Kron and Spudich (1986), takes advantage of the ability to image rhodamine-phalloidin-labeled actin filaments by fluorescence microscopy as they interact with and are translocated by myosin bound to a coverslip surface. The sliding actin in vitro motility assay is among the most elegant biochemical assays, reproducing the most fundamental property of a muscle, the ability of myosin to translocate actin using only the two highly purified proteins. It is a close in vitro correlate of the maximum unloaded shortening velocity of muscle fibers (Homsher et al., 1992). As shown here, it is simple to set up, reproducible, quantitative, and utilizes as little as 1 µg of myosin per assay. The assay is now used routinely in a large number of laboratories studying myosin and actin biochemistry. Although originally developed for studying the conventional class II myosin, it can be adapted to study unconventional myosins also.
This article discusses the design of the assay, describes the equipment required for its setup, and deals with methods for quantification and presentation of the results. Because different myosins exhibit a range of actin translocation speeds from 0.02 to 60µm/s (Sellers, 1999), it will be necessary to discuss modification of the experimental setup for fast and slow myosins. Also, differences between low- and high-duty cycle myosins are discussed. We will describe the instrumentation that we use in our system and elaborate on other options where applicable.
II. MATERIALS AND INSTRUMENTATION
The following reagents are from Sigma Chemical Company (www.sigmaaldrich.com): MOPS (Cat. No. M-5162), EGTA (Cat. No. E-4378), ATP (Cat. No. A- 5394), glucose (Cat. No. G-7528), glucose oxidase (Cat. No. G-6891), catalase (Cat. No. C-3155), and methylcellulose (Cat. No. M-0512). Rhodamine-phalloidin (Cat. No. R415) is from Molecular Probes, Inc. (www.probes.com). Nitrocellulose (superclean grade, Cat. No. 11180) is from Ernest F. Fullam, Inc. (www.fullam.com). Bovine serum albumin (BSA, Cat. No. 160069) and dithiothreitol (DTT, Cat. No. 856126) are from ICN (www.icnbiomed.com). The following items are from Thomas Scientific (www.thomassci. corn): microscope slides (Cat. No. 6684-H30) and microscope 18-mm2 No. 1 thickness coverslips (Cat. No. 6667-F24). Double sticky cellophane tape (Scotch Brand) and Sony sVHS videotapes (ST120) are from local suppliers.
The following instrumentation is used in our laboratory for the following procedures. Zeiss Axioplan microscope and objectives (www.zeiss.com), Air Therm Heater (www.wpiinc.com), intensified CCD camera from Videoscope, International (www.videoscopeintl. com), TR black-and-white videomonitor and sVHS videotape recorder (Model AG7350) from Panasonic (www.panasonic.com), Argus 10 image processor from Hamamatsu Photonics (www. hamamatsu.com), and VP110 digitizer from Motion Analysis (www.motionanalysis.com).
III. PROCEDURES
A. Construction of Flow Cells
Steps
- Prepare nitrocellulose-coated coverslips by first placing 3µl of a 1% solution of nitrocellulose in isoamylacetate directly on a No. 1 thickness 18-mm2 coverslip and spreading with the broad side of the micropipette tip. Dry the coverslip to create the film and use within 1 day. Some investigators use silicon coating of the coverslips (Fraser and Marston, 1995)
- Place two 5 × 25-mm strips of double sticky Scotch cellophane tape about 10mm apart on a 25 × 75-mm glass microscope slide. Place a nitrocellulosecoated coverslip with the coated side down onto the tracks. Press gently to create a tight seal.
B. Preparation of Rhodamine-Phalloidin- Labeled Actin
- Place 60µl of 3.3µM rhodamine-phalloidin (in methanol) into an Eppendorf tube and dry using a Speed-Vac concentrator.
- Redissolve the rhodamine-phalloidin powder in 3-5 µl of methanol.
- Add 85µl of 20mM KCl, 20mM MOPS (pH 7.4), 5mM MgCl2, 0.1mM EGTA, and 10mM DTT (buffer A). To make 100ml of buffer A, add 1 ml of 2M KCl, 1 ml of 2M MOPS (pH 7.4), 0.5ml of 1M MgCl2, 0.02 ml of 0.5M EGTA, and 154mg DTT. Bring to 100ml with H2O and adjust pH to 7.4.
- Add 10µl of a freshly diluted 20µM F-actin solution (in buffer A) and incubate for an hour on ice. The rhodamine-phalloidin actin can routinely be used as is at this stage.
- If a lower background fluoresence is desired, centrifuge for 15min at 435,000g in a TL-100 ultracentrifuge (Beckman Instruments), remove the supernatant, and gently resuspend the pink rhodamine- phalloidin-labeled actin pellet in buffer A using a pipettor tip that has been cut to widen the bore size.
- The rhodamine-phalloidin-labeled actin solution is stable for several weeks.
C. Preparation of Sample for Motility Assay
Solutions
- Wash solution: 50 mM KCl, 20 mM MOPS (pH 7.4), 5 mM MgCl2, 0.1 mM EGTA, and 5 mM DTT; to make 100ml, add 2.5 ml of 2M KCl, 1 ml of 2M MOPS, (pH 7.4), 0.5 ml of 1M MgCl2, 0.02ml of 0.5M EGTA, and 77mg of DTT. Bring volume to 100ml with H2O and pH to 7.4.
- Blocking solution: 1 mg/ml BSA in 0.5M NaCl, 20mM MOPS (pH 7.0), 0.1mM EGTA, and 1 mM DTT solution. To make 100ml of blocking solution, add 10ml of 5M NaCl, 1 ml of 2M MOPS (pH 7.4), 0.02ml of 0.5M EGTA, 15.4mg of DTT, and 100mg of BSA. Bring to 100ml with H2O and pH to 7.0.
- Rhodamine-phalloidin-labeled actin solution: 20nM rhodamine-phalloidin-labeled actin. To make 1 ml, take 10µl of 2µM rhodamine-phalloidin-labeled actin, 10µl of 500mM DTT, and 980µl of wash solution.
- ATP-actin wash: 1 mM ATP and 5µM F-actin (unlabeled) in wash solution. To make 1 ml, add 10µl of 0.1M ATP and 50µl of 100µM F-actin to 940µl of wash solution.
- 4X stock solution: 80mM MOPS (pH 7.4), 20mM MgCl2, and 0.4mM EGTA. To make 100ml, add 4ml of 2M MOPS (pH 7.4), 2ml of 1M MgCl2, and 0.08ml of 0.5M EGTA. Bring volume to 100ml with H2O and pH to 7.4.
- 1.4% methycellulose solution: Dissolve 1.4g of methylcellulose in a final volume of 100ml of H2O by stirring overnight. Occasionally it is necessary to homogenize the solution with a glass-Teflon homogenizer to aid in solubilization. Dialyze the dissoved methylcellulose against 4 liters of H2O overnight. Divide into 10-ml aliquots and freeze at -20°C.
- Motility buffer: 50mM KCl, 20mM MOPS (pH 7.4), 5mM MgCl2, 0.1mM EGTA, 1 mM ATP, 50mM DTT, 2.5mg/ml glucose, 0.1mg/ml glucose oxidase, and 0.02mg/ml catalase. To make 1 ml, add 250µl of 4X stock solution, 10µl of 0.1M ATP, 25µl of 2M KCl, 100µl of 0.5M DTT (prepare fresh each day by adding 77mg DTT to 1 ml of H2O), 20µl of 125mg/ml glucose, 20µl of 5mg/mol glucose oxidase, 1 µl of 20mg/ml catalase, and 573 µl of H2O. If methylcellulose is to be used in the motility buffer (see later), then add 500µl of 1.4% methylcellulose and 73 µl of H2O.
Steps
- Apply 0.2mg/ml myosin in 0.5M NaCl, 20mM MOPS (pH 7.0), 0.1 mM EGTA, and 1 mM DTT to fill the flow chamber. Wait 1 min.
- Wash with 75 µl of blocking buffer. Wait 1 min.
- Wash with 75 µl of wash solution, followed by 75 µl of ATP-actin wash solution. Wait 1 min. This step is optional.
- Wash with 75 µl of wash solution, followed by 75 µl of rhodamine-phalloidin-labeled actin solution. Wait 1 min.
- Initiate reaction by the addition of 75 µl of motility buffer.
- Place slide on microscope stage and image.
Comments
In the protocol just described, myosin is bound to the surface as monomers. If myosin is to be bound as filaments, it is necessary to block with BSA that is in a low ionic strength solution, such as the wash solution. Alternatively, heavy meromyosin or a soluble unconventional myosin can be applied to the flow chamber at either low or high ionic strength. In some cases, myosin or HMM can be attached to the surface via specific antibodies against their carboxyl-terminal sequence (Winkelmann et al., 1995; Cuda et al., 1993; Reck-Peterson et al., 2001), which may also serve the purpose of further purifying the desired isoform of myosin. If actin filaments are binding poorly to the surface, the motility buffer can be augmented with 0.7% methlycellulose (modify motility buffer preparation to add 0.5 ml of 1.4% methylcellulose and add less water to bring the final volume to 1 ml. Note that this solution is very viscous and must be mixed well).
Although each myosin has its own characteristic velocity, the velocity of a given myosin can vary with ionic and assay conditions. In general the velocity tends to increase as the ionic strength is raised from 20 to 100mM and increases with temperature. At higher ionic strengths the actin filaments typically begin to become weakly associated with the myosin-coated surface and move erratically. The velocity of actin filament translocation by some myosins, such as vertebrate smooth muscle myosin and Limulus-striated muscle myosin, is increased markedly (two to four times) by the inclusion of 200nM tropomyosin in the motility buffer (Wang et al., 1993; Umemoto and Sellers, 1990). However, tropomyosin inhibits the movement of brush border myosin I (Collins et al., 1990).
Step 3 is optional. It is often included to improve the "quality" of movement by binding unlabeled actin to noncycling myosin heads that would otherwise bind and tether the labeled actin added subsequently. This step can be omitted if the myosin is capable of moving actin filaments smoothly. For myosin V, better quality movement can be obtained by first blocking the surface with 0.1-1.0mg/ml of BSA before adding the myosin.
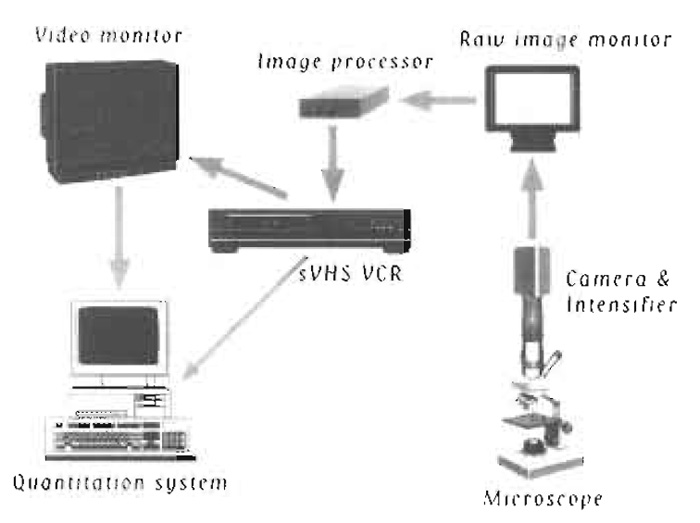 |
| FIGURE 1 Schematic diagram of equipment setup. |
D. Recording and Quantifying Data Steps and Equipment
A schematic diagram of the equipment setup is shown in Fig. 1. The following describes the equipment used in our laboratory. There is a wide selection of video microscopy equipment represented by many manufacturers.
- Place the microscope slide under a 100X, 1.4 NA Plan-Neofluor objective in an Axioplan microscope (both from Carl Zeiss, Germany) equipped for epifluorescence. Other microscopes, including ones with an inverted format, are also suitable and a variety of objectives can be used, but note that high numerical apertures are required for maximal brightness. Illumination is via a 100-W mercury lamp. An IR filter should be placed between the source and the sample to attenuate heat; neutral density filters are useful to attenuate light intensity if needed. A filter set designed for rhodamine fluorescence measurements should be utilized in the filter cube. For quantitative work it is necessary to control the temperature of the assay. This can be accomplished in several ways. The most inexpensive way is to create an air curtain using a hair dryer. Other methods include fabricating a water jacket for the objective and to use a circulating water bath to regulate temperature or creating an environmental box heated with an Airtherm heater (World Precision Instruments). In our experience, commercial stage heaters are not sufficient as oil immersion objectives act as large heat sinks.
- Image actin filaments using an ICCD 350F intensified CDD camera (Videoscope International). Other low-light systems are possible, such as an SIT camera or intensified SIT camera. Several manufacturers sell this equipment. These camera systems produce an analog output that can be viewed on a standard black-and-white video monitor (TR Panasonic) and recorded on an AG7350 sVHS recorder (Panasonic). It is also possible to collect data digitally using a cooled CCD camera linked to a computer.
- It is useful to process the raw image using an image processor such as the Argus 10 or Argus 20 (Hamamatsu Photonics) to perform frame averaging and/or background subtraction. There are several commercial software packages that can do this also. Display the processed image on another video monitor.
- Determine the movement of individual actin filaments using an automated tracking system equipped with a VP110 digitizer from Motion Analysis. Many investigators have created there own software routines to track actin filaments in a semiautomated manner.
Comments
Given the range of motility rates of different myosins, there is no standard number of frames to average in order to get a good image. If the myosin is moving at 5 µm/s, a 2 or 4 frame average is used along with high illumination levels that can be tolerated because of the short exposure time needed to define a filament path. With slow myosins that may move at rates of less than 0.1 µm/s, it is possible to average 64 frames and to reduce the light intensity so that longer recording periods are possible.
The quantification of the rate of actin filament sliding is perhaps the most difficult part of the motility assay. The method just described requires a fairly expensive apparatus that is accurate, very fast, and can give unbiased results (for an extensive discussion of quantification of data, see Homsher et al., 1992). The user inputs the desired sampling rate and sampling time to collect data from either the live image or a prerecorded image. The computer determines the centroid position of each actin filament in each frame, connects the centroids to form paths, calculates the incremental velocity between each successive data point in a path, and, finally, calculates a mean + SD for each filament path. This process takes only seconds for a field of 25-30 actin filaments. Several investigators use commercial frame grabbers and write their own software for semiautomated tracking of actin filaments (Work and Warshaw, 1992; Marston et al., 1996). There is at least one free downloadable source of semiautomatic tracking software available (http://mCl1.mcri.ac.uk/retrac/).
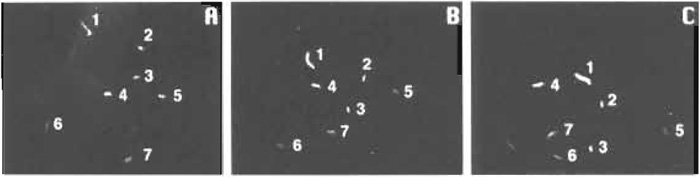 |
| FIGURE 2 One-second intervals of actin filaments moving over a myosin-coated surface. |
E. Presentation of Data
Figure 2 shows three frames taken at 1-s intervals of actin filaments moving over a myosin-coated surface as it would appear on the video monitor. Data from such an experiment are presented most commonly as the mean ± SD of the velocity of the population of actin filaments. In general, the SD is typically 10-20% of the mean. There are two cases where merely reporting this number does not always accurately describe what is occurring in the assay. One such case is when something (perhaps a regulatory protein) is affecting the number of filaments that are moving. If, in the absence of the regulatory protein, >95% of the actin filaments are moving at 1 µm/s whereas only 5% of the filaments move at any velocity in the presence of the regulatory protein, reporting only the mean value for the velocity in each case does not reflect the difference that is observed in the assay between the two conditions. A better method for data display for this example is to display all data in the form of a histogram so that one can see that most of the actin filaments are not moving in the presence of the regulatory protein. This display also allows the reader to see whether the regulatory protein affects the speed of movement of the few actin filaments that remain moving. The other case where more complex data display is necessary is if the filaments are moving erratically. Here the mean velocity will underestimate the "instantaneous" velocity and will have a considerably larger standard deviation than that of smoothly moving filaments. One way to display these data graphically is to show a path plot in which the centroid position of the moving actin filaments is plotted in two-dimensional space as a function of time (Fig. 3).
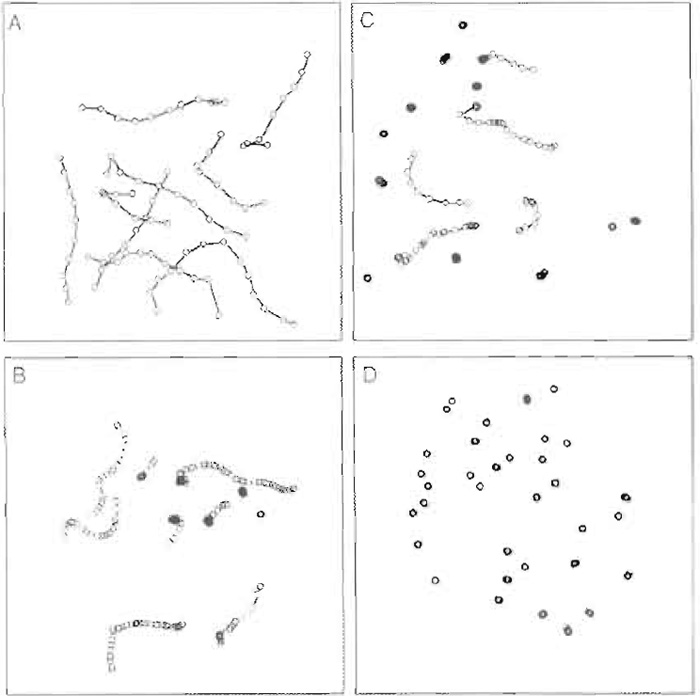 |
| FIGURE 3 Actin filaments plotted in two-dimensional space as a function of time. A) smoothly moving actin filaments; B) actin filaments moving more erratically; C) a mixture of moving and nonmoving actin filaments; D) nonmoving actin filaments. |
IV. PITFALLS
- Actin filaments are moving erratically or only a fraction of the actin filaments are moving. The cause of this phenomena is usually noncycling heads in the preparation. Using the actin-ATP wash solution described in Section III,C,3 usually helps or eliminates the problem, but if erratic motility persists, do the following. Bring the myosin solution to 0.5 M in NaCl and add actin to a final concentration of 10µM, ATP to 2mM, and MgCl2 to 5mM. Immediately sediment at 435,000g for 15mn in a Beckman TL-100 ultracentrifuge. Remove the supernatant and use it for the motility assay.
- Actin filaments shear quickly into small dots. Several things can contribute to this phenomenon. Poor-quality myosin containing a significant number of noncycling heads might be a problem. See Pitfall 1 for advice on how to remove these. Decreasing the density of myosin heads on the surface and/or increasing the ionic strength of the assay solution also sometimes helps, as does decreasing the light intensity. In general, myosin bound to the surface as monomers tend to shear less than myosin bound as filaments.
- Actin filaments appear wobbly when they move or are moving in a back and forward type manner. If the assay does not contain methylcellulose, any portion of the actin filament that is not bound along its length by myosin will experience Brownian motion and appear very wobbly. Even though these filaments may be moving, their movement will be erratic and difficult to quantify. Increasing the density of myosin on the surface, decreasing the ionic strength of the assay, or using methylcellulose in the assay buffer usually helps. The back and forward motion of the actin filaments seen in the presence of methylcellulose is merely Brownian motion in the presence of the viscous solution where the actin filament is restricted to move mostly along its long axis. If the actin filament is not bound it will move back and forward. Increasing the density of myosin or decreasing the ionic strength of the solution should help.
- Actin filaments photobleach rapidly. Decrease the light intensity if possible and use image processing to do frame averaging to improve the signal-to-noise ratio. Degas the solutions. Make sure the glucose, glucose oxidase, and catalase components of the motility buffer are good. The presence of 50mM DTT also aids in preventing photobleaching.
- Actin filaments leave comet tail-like images as they move. If you are frame averaging, merely decrease the number of frames averaged. If not, the problem is likely to be encountered when the actin filaments are moving fast and a non-CCD type camera is used. The streaking or persistence in this case is related to the fact that the tube cameras effectively average about four frames in producing their image. The persistence can be attenuated by increasing the light level or by switching to a lower magnification objective.
Acknowledgments
I thank Qian Xu and Takeshi Sakamoto for critical reading of the manuscript.
References
Collins, K., Sellers, J. R., and Matsudaira, P. (1990). Calmodulin dissociation regulates brush border myosin I (110-kD-calmodulin) mechanochemical activity in vitro. J. Cell Biol. 110, 1137-1147.
Cuda, G., Fananapazir, L., Zhu, W.-S., Sellers, J. R., and Epstein, N. D. (1993). Skeletal muscle expression and abnormal function of β-myosin in hypertrophic cardiomyopathy. J. Clin. Invest. 91, 2861-2865.
Fraser, I. D. C., and Marston, S. B. (1995). In vitro motility analysis of smooth muscle caldesmon control of actin-tropomyosin filament movement. J. Biol. Chem. 270, 19688-19693.
Homsher, E., Wang, F., and Sellers, J. R. (1992). Factors affecting movement of F-actin filaments propelled by skeletal muscle heavy meromyosin. Am. J. Physiol. Cell Physiol. 262, C714-C723.
Kron, S. J., and Spudich, J. A. (1986). Fluorescent actin filaments move on myosin fixed to a glass surface. Proc. Natl. Acad. Sci. USA 83, 6272-6276.
Marston, S. B., Fraser, I. D. C., Bing, W., and Roper, G. (1996). A simple method for automatic tracking of actin filaments in the motility assay. J. Musc. Res. Cell Motil. 17, 497-506.
Reck-Peterson, S. L., Tyska, M. J., Novick, P. J., and Mooseker, M. S. (2001). The yeast class V myosins, Myo2p and Myo4p, are nonprocessive actin-based motors. J. Cell Biol. 153, 1121-1126.
Sellers, J. R. (1999). "Myosins." Oxford Univ. Press, Oxford.
Umemoto, S., and Sellers, J. R. (1990). Characterization of in vitro motility assays using smooth muscle and cytoplasmic myosins. J. Biol. Chem. 265, 14864-14869.
Wang, F., Martin, B. M., and Sellers, J. R. (1993). Regulation of actomyosin interactions in Limulus muscle proteins. J. Biol. Chem. 268, 3776-3780.
Winkelmann, D. A., Bourdieu, L., Kinose, F., and Libchaber, A. (1995). Motility assays using myosin attached to surfaces through specific binding to monoclonal antibodies. Biophys. J. 68(Suppl.), 72S.
Work, S. S., and Warshaw, D. M. (1992). Computer-assisted tracking of actin filament motility. Anal. Biochem. 202, 275-285.
Support our developers


