Live Cell DNA Labeling and Multiphoton/Confocal Microscopy
I. INTRODUCTIONTechniques for the discrimination and location of DNA, chromatin architecture, chromosomes, nuclear superstructures, and cell nuclei in their various forms through the cell cycle are of increasing interest in the biosciences and the generation of automated screening systems. The appropriate selection of a DNA-labeling dye may also be important for tracking events in microscale devices (e.g., lab on a chip). Here the critical issue is the transmittance advantage of longer wavelengths using external laser excitation or an incorporated source (e.g., a red laser diode within an optical biochip).
Advanced microscopy methods such as multiphoton excitation laser scanning (MPLSM) are now becoming more generally accessible, as they provide significant advantages in live cell studies. Although it is apparent that MPLSM technology will evolve, providing more convenient and adaptable systems, the principles discussed here will still apply. Currently, MPLSM instrumentation usually consists of a tuneable femtosecond pulsed infrared (IR) laser attached to a scanning microscope with IR-compatible optics to ensure efficient transfer of long wavelength light (690-1000nm). Such a laser configuration provides virtually simultaneous delivery of two photons to a focal point of the microscope objective lens, achieving volume limited excitation by two or more photons of any fluorophor molecule with appropriate absorption characteristics. The advantages of this approach compared to confocal laser scanning microscopy (CLSM) are numerous. Because photons are only emitted from the "in focus" plane, all the photons can be collected via a nondescanning route, including those photons scattered by the sample and usually rejected at the confocal aperture. This provides a massively improved efficiency of emission light collection, an important consideration in photon-limited systems (White and Errington, 2002). Importantly, infrared light penetrates biological material further than shorter wavelengths and the potential damaging effects of ultraviolet (UV)-visible wavelengths are avoided. Reviews of the subject and information on two-photon fluorescence excitation cross sections are available (e.g., Denk et al., 1995; Williams et al., 2001; Albota et al., 1998). However, a pragmatic outcome of the combined advantages of MPLSM is a resurgence of the use of W-excited fluorescent probes, although these have pitfalls for use with GFP-based fluorophors (see later). Two-photon fluorescence absorption and emission spectra have been obtained for DNA probes relevant for live cell work. The technique of multi-photon excitation of a fluorophore, using a pulsed laser light source, provides solutions to several problems associated with continuous wave excitation via single photon absorption. Typically for multi-photon excitation the sample is illuminated with light of a wavelength which is approximately twice (or three times) the wavelenghth of the absorption peak of the fluorophore in use (Errington et al., 2005) (Bestvater et al., 2002; Smith et al., 2000; van Zandvoort et al., 2002) and a selection is shown in Table I.
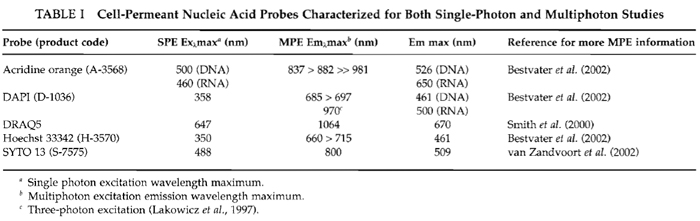 |
DNA offers a highly attractive substrate for chemical and biophysical probe interactions and there are excellent references for the chemical descriptions and cytometric applications of a wide range of DNA dyes (Darzynkiewicz et al., 1990; Latt and Langlois, 1990; Waggoner, 1990). The forms of interaction range from covalent binding, inter- and intrastrand cross-linking, adduct formation, to ternary complex formation with DNA-binding proteins. Additionally, major or minor groove residence are potentially stabilized through hydrogen bonding and van der Waals forces, phosphate group interactions, and various levels of intercalation between the base pairs. A restricted number of agents are now available for DNA labeling in live cell systems and MPLSM. The most frequently used are UV-excitable fluorochromes such as the bisbenzimidazole dyes Hoechst 33258 and Hoechst 33342, and the agent DAPI (4', 6-diamidino-2-phenylindole). Cellpermeant, acridine orange displays metachromatic staining of nucleic acids that precludes its convenient use as an exclusively DNA-discriminating probe. The introduction of cell-permeant cyanine SYTO nucleic acid stains (Frey, 1995; Frey et al., 1995) has provided many different reagents with a wide range of spectral characteristics. These agents passively diffuse through the membrane of most cells and can be excited by UV or visible light but stain RNA and DNA in both live and dead eukaryotic cells. Such dyes would be accessible to two-photon excitation (Table I). Their extremely low intrinsic fluorescence, with quantum yields typically less than 0.01 unbound (>0.4 when bound to nucleic acids), reduces the need to remove extracellular dye prior to imaging. It has been stressed that the highly versatile SYTO dyes do not act exclusively as nuclear stains in live cells and that they should not be equated in this regard with compounds such as DAPI or the Hoechst 33258 and Hoechst 33342 dyes.
At the other end of the fluorescence spectrum, DRAQ5, a DNA-binding anthraquinone derivative, can provide sufficient discrimination of cellular DNA content in multiparameter fluorescence studies. Anthraquinones are a group of synthetic DNAintercalating agents (Lown et al., 1985) but are only weakly fluorescence (Bell, 1988). DRAQ5 is a modified anthraquinone with enhanced DNA affinity and intracellular selectivity for nuclear DNA (Smith et al., 1999, 2000). DRAQ5 appears to achieve its live cell nuclear discrimination by its high affinity for DNA. Excitation at the 647-nm wavelength, close to the Exλmax, produces a fluorescence spectrum extending from 665-nm out to beyond 780-nm wavelengths. Thus the emission spectrum is beyond that of fluorescein, phycoeryrthrin, Texas Red, Cy 3, and, perhaps most importantly, EGFP. (Waggoner, 1990) DRAQ5 enters cells and nuclei rapidly, the broad excitation spectrum of DRAQ5 means that flow cytometric applications can utilize excitation wavelengths down to 488nm (Smith et al., 2000); two-photon excitation is also permissible at wavelengths >1047nm. The two-photon dark excitation region of DRAQ5 (720-860nm) permits detection of low-intensity intracellular fluorescence of other probes by MPLSM and then definition of nuclear location by CLSM. This article provides simple procedures for two DNA-specific probes for living cells and their use in MPLSM studies. These dyes sit at either end of the excitation spectrum, Hoechst 33342 (UV excitable) and DRAQ5 (far red excitable), and therefore offer maximum flexibility in multiprobe analyses.
II. MATERIALS AND INSTRUMENTATION
Materials
DRAQ5 (molecular weight 412.54) dye is supplied as an aqueous stock solution of 5mM (Biostatus Ltd) and can be diluted in aqueous buffers or added directly to full culture medium. DRAQ5 is stable at room temperature as a stock solution but can be stored routinely at 4°C although freezing of the stock solution should be avoided. 33342 Hoechst (H-3570; termed here Hoechst 33342) has a molecular weight of 615.99 in the trihydrochloride/trihydrate form and is supplied by Molecular Probes Inc. as a 10-mg/ml stock solution in water in a light-excluding container. It is routinely stored at 4°C without freezing. With both DNA dyes, appropriate safety information is available from the suppliers. Because both agents have the potential to damage DNA, they should be considered both cytotoxic and potentially mutagenic. Currently available information indicates that although they are not listed as carcinogens by the National Toxicology Program (NTP), the International Agency for Research on Cancer (IARC), or the Occupational Safety and Health Administration (OSHA), the dyes should be treated as such. Mitotracker Orange CMTMRos (M7510) is supplied by Molecular Probes in 20 × 50-µg aliquots, stored at-20°C Before use a stock solution is made by the addition of 50 gl dry dimethyl sulfoticle, which can be subsequently frozen; however, repeated freeze-thawing is not recommended. Zinquin ethyl ester [Zinquin E, [2-methyl-8- (4-methylphenylsulfonylamino) quinolinyl] oxyacetic acid ethyl ester] (Alexis Corporation, Nottingham, UK) is stored as a 5 mM stock solution in ethanol at 4°C The HEPES buffer (1M) (Sigma; H-0887) filter-sterilized solution is stored at 4°C Stock preparations of 8% paraformaldehyde (Sigma; P 6148) are made up in phosphate-buffered saline (PBS) lacking calcium and magnesium and are kept in aliquots of 20ml at -20°C All live cell work is conducted with cells seeded onto Nunc Lab-tek (#1 coverglass) chambered wells, appropriate for high-resolution imaging and recommended when handling cytotoxic agents.
Cytometry
The flow cytometry system is a FACS Vantage cell sorter (Becton Dickinson Inc., Cowley, UK) incorporating two lasers: (1) a Coherent Enterprise II laser simultaneously emitting at multiline UV (350- to 360- nm range) and 488-nm wavelengths and (2) a Spectra Physics 127-35 helium-neon laser (maximum 35-mW output) emitting at 633 nm with a temporal separation of about 25g from that of the primary 488-nm beam for the UV or red lines. Light scatter signals are collected as standard. The analysis optics are (i) primary beam-originating signals analyzed at FL3 (barrier filter of LP715nm) after reflection at a SP610 dichroic and (ii) delayed beam-originating signals analyzed at FL4 (barrier filter of LP695nm for DRAQ5 emission or DF660/20nm for Hoechst 33342 emission) or at FL5 (barrier filter of DF424/44 nm for Hoechst 33342 emission). Forward and 90° light scatter are analyzed to exclude any cell debris. Optical filters are originally sourced from Becton Dickinson Inc. or Melles Griot Inc.). All parameters are analyzed using CellQuest software (Becton Dickinson Inc.).
Imaging
Multiphoton excitation at wavelengths between 720 and 980 nm uses a laser-scanning microscope comprising a 1024 MP scanning unit controlled by LaserSharp software (Bio-Rad Cell Science Division) attached to a Zeiss Axiovert 135 (Carl Zeiss Ltd.). MPLSM mode is achieved with a Verdi- Mira excitation source (Coherent UK Ltd.). The Mira Optima 900-F (Coherent UK Ltd.) is a simple, stable titanium:sapphire, KLM mode-locking system with X-wave optics, a broadband, single optics set tuning 700-1000nm, and a purged enclosure. The continuous wave diode pump laser (Verdi) operates at 5 W at 532nm. CLSM mode is achieved using the same scanning unit and 488-, 568-, and 647-nm lines of a krypton-argon laser. All images are collected with either a ×63, 1.4 NA oil immersion lens or a ×40 1.3 NA oil immersion lens. Typically, each optical slice consists of 512 × 512 (x,y resolution = 0.35gm, z resolution is approximately 1 µm). Multiphoton excitation at 1047nm uses a similar BioRad 1024MP system incorporating an all solid-state excitation source Nd:YLF laser (Coherent UK Ltd.) and mode-locked femtosecond pulsed laser providing twophoton excitation of DRAQ5 at a 1047-nm wavelength at 15 mW with detection of fluorescence in the far red.
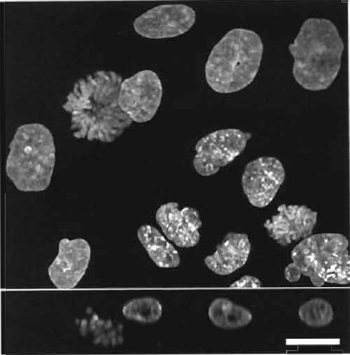 |
| FIGURE 1 Two-photon excitation (Exλ 750nm) of nuclear-located Hoechst 33342 in live HeLa cells (5µM x 60min). (Top) Main image is a z-axis projection of a series of optical slices (Emλ > 460 nm) revealing intranuclear chromatin architecture and a display of condensed metaphase chromosomes in a mitotic cell. (Bottom) The corresponding z-axis slice for an x axis intercepting the mitotic and three adjacent cells. Size bar: 10µm. |
A. General Considerations
Hoechst 33342 is more lipophilic than Hoechst 33258 and is the form recommended for live cell studies showing high affinity for A-T base pairs through noncovalent binding in the minor groove of DNA. The ligand shows fluorescence enhancement upon binding. DRAQ5 is weakly fluorescent but has high DNA affinity and intracellular selectivity for nuclear DNA due to increased AT base pair preference but with no apparent fluorescence enhancement upon binding. When considering live cell labeling, the performance status of the cell is the most critical issue for achieving optimal staining. There is a subtle shift in the violet to red bias in the emission spectrum of Hoechst 33342 upon DNA binding. A small (approximately 10 nm) red shift in peak wavelength also occurs upon DRAQ5 binding. Nuclear staining is straightforward and most cultured cells label well in full culture medium (containing 10% fetal calf serum) supplemented with 10mM HEPES, reaching equilibrium over some 5-60min for concentrations in the 1-20µM range. Staining in phosphate buffers is less efficient. Staining rate is enhanced at 37°C. The following procedures are for generic uses of the dyes.
B. Two-Photon Excitation of Hoechst 33342
Steps
- Seed cells onto a sterile glass coverslip in a culture dish (approximately 1 × 10⁵ cells/25 cm2) or seed into a Nunc chamber coverslip. Incubate attached cultures under standard conditions until analysis is required. Add Hoechst 33342 directly to culture medium at a final concentration of 5µM (3.1 µg/ml).
- For greater pH control conditions, especially when manipulating cells out of 5% CO2 incubation, supplement the culture medium with HEPES buffer (final concentration 5-25 mM).
- After a 60-min incubation (minimum of 15 min) at 37°C, wash coverslips gently in PBS to preserve mitotic cell attachment. Mount coverslips in an inverted position onto a microscope slide in PBS. To avoid cell crushing, the edges of the coverslip can be supported and sealed (e.g., using a piping of petroleum jelly). To clean the noncell side of the coverslip, the surface can be wiped (lens tissue).
- Imaging conditions and typical results are shown in Fig. 1.
C. Two-Photon Coexcitation of Different Fluorophors
Steps
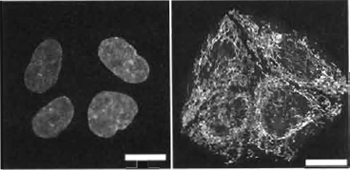 |
| FIGURE 2 Dual images of four live HeLa cells using two- photon coexcitation (Exλ 800nm) of nuclear-located Hoechst 33342 (5µM× 60min; left side Emλ 455/25nm) and cytoplasmic Mitotracker orange CMTMRos (5 ng/ml × 5 min; right side Emλ 585/32 nm). Size bar: 10 µm. |
- Generate cultures and label Hoechst 33342 as in Section III,B.
- A second cell-permeant probe may be introduced concurrently with Hoechst 33342 staining or after culture washing. Typically, Hoechst 33342-labeled cells will lose approximately 25% nuclear fluorescence over a 15- to 30-min postlabeling period in fresh medium. Here we exemplify the signal separation of Hoechst 33342 and the probe Mitotracker Orange CMTMRos, the latter introduced into the culture medium at 5ng/ml for the final 5-min period of Hoechst 33342 labeling.
- Sample preparation is as in Section III,B, whereas dual-imaging conditions and typical results are shown in Fig. 2.
D. Hoechst 33342 Staining Kinetics and Population Spectral Shift Analysis
Steps
- Detach cultured cells by a standard trypsin/ EDTA method and resuspend at 2 × 10⁵ cell/ml full culture medium supplemented with 10 mM HEPES and allow to equilibrate at 37°C prior to Hoechst 33342 addition (see Section III,B).
- Analyze single cell suspensions, in the presence of the dye, by one-photon UV excitation flow cytometry and acquire data for different dye uptake periods.
- The change of spectral emission with dye uptake by mouse L cells is shown for populations of 104 cells in Fig. 3. Cells showing a rapid, essentially immediate, red shift are damaged and can be excluded by additional electronic gating using light scatter changes.
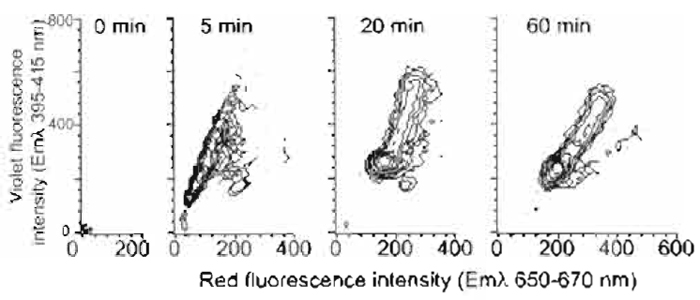 |
| FIGURE 3 Flow cytometric contour plots of mouse L-cell populations
undergoing a violet-to-red spectral shift in fluorescence
during nuclear localization of Hoechst 33342 (10µM; 4 x 10⁵ cells/ml) using one-photon excitation by multiline UV. The broad
fluorescence emission spectrum was monitored simultaneously in
the red region (Emλ 660/20nm) and the violet region (Emλ 405/
20nm) for 105 cells at the specified time points. Data show the rapid development of violet fluorescence and the later red shift. Residual levels of damaged cells not excluded by light scatter gating are evident by their rapid red-shift pattern. |
E. Two-Photon Excitation of Hoechst 33342 and Spectral Shift Analysis
Steps
- Generate cultures and label Hoechst 33342 as in Section III,B.
- Sample preparation is as in Section III,B with dual-imaging conditions and typical results shown in Fig. 4. The dual images of live mouse L cells show the differences in emission by condensed chromatin in metaphase cells lacking a nuclear envelope and interphase nuclei.
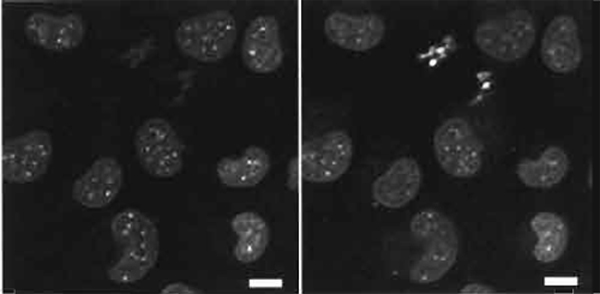 |
| FIGURE 4 Dual images of live mouse L cells using two-photon excitation (Exλ 750nm) of nuclear-located Hoechst 33342 (5µM× 60min) showing a red-biased fluoresence emission in metaphase versus interphase cells (right side shows Emλ 585/32 nm and the left side shows Emλ 405/35 nm). Size bar: 10 µm. |
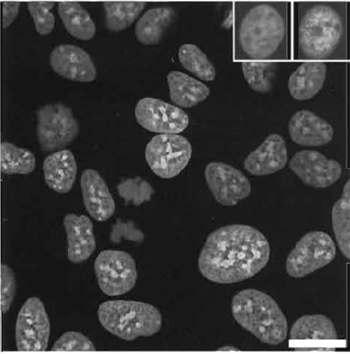 |
| FIGURE 5 Confocal image of live MCF-7 breast tumor cells using one-photon excitation (Exλ 647nm; Emλ 680/32nm) of nuclearlocated DRAQ5 (10µM× 10min) revealing nuclear architecture and the presence of an anaphase cell. (Left insert) Nuclear retention of the dye following preparation washing and conventional paraformaldehyde fixation for the purposes of subsequent immunofluorescence colocalization analysis. (Right insert) An example of immunolocalization is shown for the expression of nuclear-located protein detected using a secondary antibody conjugated to Alexa488 (Exλ 488 nm; Emλ 522/35 nm). Size bar: 10 µm. |
F. One-Photon Excitation of DRAQ5 for Live and Persistence in Fixed Cells
Steps
- Generate cultures and mount coverslips as in Section III,B.
- Cultures can be exposed to DRAQ5 by direct addition to full culture medium (10µM × 10min) prior to coverslip washing (optional) and mounting.However, the rapid staining kinetics of DRAQ5 (see Section III,G) permit direct introduction of the dye to already mounted samples and imaging immediately for nuclear tracing.
- Figure 5 shows one-photon excitation images of nuclear-located DRAQ5 and dye persistence following standard 4% paraformaldehye fixation and the sample subsequently processed for immunofluorescence, which permits colocalization of an immunofluorescence signal (Alexa 488) with nuclear structures.
G. DRAQ5 Staining Kinetics and DNA Content Analysis
Steps
- Prepare cells as in Section III,D and the conditions given in Fig. 6.
- DRAQ5 far-red fluorescence is detectable within
seconds of dye addition to cell suspensions and can be
generated by both 488- and 633-nm wavelength onephoton
excitation with similar outcomes. The optical
configurations are shown in Fig. 6. The flow cytometry
protocol acquires fluorescence emissions with time and shows the ability to discriminate cells of different DNA contents.
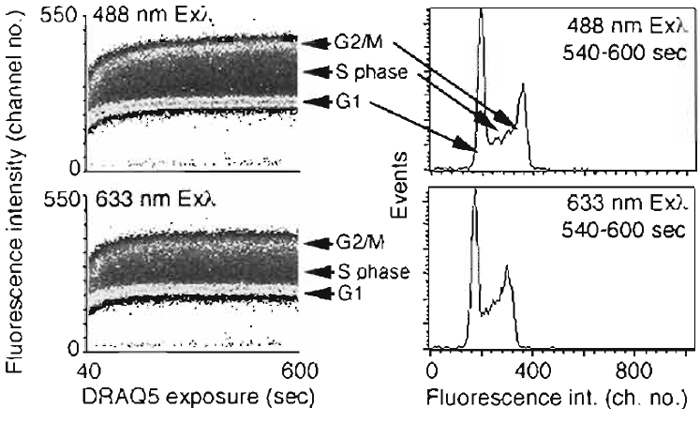 |
| FIGURE 6 Flow cytometric analysis of the rapid cellular uptake of DRAQ5 demonstrating the ability to
discriminate DNA content using one-photon excitation at either Exλ 488nm (Emλ > 715nm) or Exλ 633nm
(Emλ > 695nm). Suspensions of live human B-cell lymphoma cells (4 × 10⁵ cells/ml) were exposed to 20gM
DRAQ5 in complete medium supplemented with 10mM HEPES and incubated at 37°C for 600s. (Left)
Density dot plots for continuous event acquisition for sequential 488 nm then 633 nm excitation, monitoring
far red fluorescence commencing 40s after dye addition (total of approximately 1.2 × 10⁶ cells acquired; background
unlabeled cells located in channel < 25). Data show rapid equilibration of DNA staining, the discrimination even at early staining times of relative DNA content, and the final equivalence of the content, distributions (right) irrespective of blue or red line excitation. |
H. Discrimination of the Intracellular Location of Two-Photon Excited Fluorophors using DRAQ5
Steps
- Generate cultures as in Section III,B and probe for the expression of a given characteristic using a cellpermeant reporter (e.g., here using the UV-excitable probe Zinquin-E for free zinc ions; Zalewski et al., 1993). Following probe treatment, cells can be processed for nuclear tracing using one-photon excitation achieved rapidly by mounting of cells directly in PBS containing 20 µM DRAQ5 (see Fig. 7).
- If two-photon acquisition of a DRAQ5 image is sought, then wavelengths beyond 1 µm are required. Figure 7 shows such acquisition (Exλ 1047nm) for ethanol-fixed human lymphoma cells mounted in 20 µM DRAQ5 obtained using a 60× N.A. 1.4 oil objective, a zoom of 1.9, and a Kalman filtering average of 37 scans.
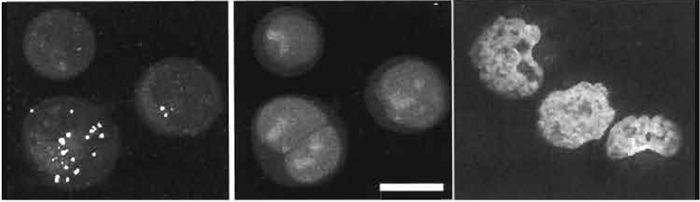 |
| FIGURE 7 Sequential acquisition of a nuclear DNA signal (single-photon excitation of DRAQ5; Exλ 647nm; Emλ 680/32nm; 10µM× 10min; center) and the intracellular localization of a W-excitable fluorophor (two-photon excitation of the intracellular Zn2+-sensitive reporting probe Zinquin-E; Exλ 780nm; Emλ > 460nm; left) in live human B-cell lymphoma cells. Images are dual-channel projections revealing bright punctate Zinquin-Zn2+ complexes found to be exclusively cytoplasmic upon three-dimensional image reconstruction. (Right) Two-photon excitation of nuclear-located DRAQ5 using a YLF mode-locked femtosecond pulsed laser (Exλ 1047nm and far-red fluorescence) in ethanol-fixed human lymphoma cell cytocentrifuge preparations mounted in 20µM DRAQ5 in phosphate-buffered saline. Size bar: 10µm. |
IV. COMMENTS
- Probe selection issues include (i) excitation and emission spectral characteristics, including differential spectral shifts pertinent for multiparameter imaging; (ii) dye "brightness" dictated by molar absorptivity, quantum yield with fluorescent enhancement; and (iii) advanced properties for more complex studies, including lifetime signatures and molecular quenching capabilities.
- Fluorescence lifetime microscopy (FLIM) provides an important avenue for investigating the binding of DNA probes to macromolecular structures. The image contrast is concentration insensitive, but is sensitive to the local environment. Multiphoton instruments can be adapted to capture fluorescence decay signals. Some dyes that cannot be used to differentiate DNA/RNA using steady-state fluorescence do have unique lifetime signatures when bound to these different sites. Hence this provides a mechanism for deriving the spatial map of RNA and DNA location sites within a cell (Lakowicz et al., 1997; van Zandvoort et al., 2002).
- Investigators should always question both the timing and the purpose of the staining within the analysis procedures. The rapid staining of cells by DRAQ5 is a significant advantage when tracking events over short time frames and nuclear discrimination can be achieved within seconds.
V. PITFALLS
- MPLSM requires careful selection of optical filters capable of efficient IR blocking.
- MPLSM requires a fundamental shift in experimental design, as using a single (albeit well-chosen) wavelength will excite multiple probes, and so good separation of the emission wavelengths is absolutely required. Thus the UV-excitable dyes are limited when two-photon excitation of GFP-based fluorophors is undertaken due to coexcitation and overlap of the fluorescence spectra.
- Live cell labeling is subject to micropharmacokinetic effects, which can vary with cell type. For example, the ability of bisbenzimiazoles dyes to access cellular DNA can be affected by dye effiux (e.g., via a membrane-located p-glycoprotein encoded by the mdr-1 gene; Morgan et al., 1989), nuclear ejection (Smith, 1988), and differences in chromatin compactness. DRAQ5 is less subject to drug resistance effiux, but at suboptimal concentrations, nuclear access may restrict binding potential.
- Both dyes discussed can damage DNA. Benzimidazoles can cause DNA strand breaks by photolytic (UV) DNA strand cleavage or as a consequence of ternary complex formation with intranuclear DNA topoisomerases I and II. Anthraquinones can also trap DNA topoisomerases but may also cause DNA-protein cross-linking damage. Some cells appear to be resistant to Hoechst 33342 cytotoxicity (e.g., HeLa), whereas others will undergo apoptosis readily (e.g., p53 wild-type B-cell lymphoma). In the case of DRAQ5, toxicity is clearly dose dependent (20nM- 20µM range), and the persistence of the agent makes it unsuitable for long-term (>12h) tracking experiments or viable cell sorting. The initial stress responses to dye binding may be occult but result in progressive cell cycle arrest or indeed modulation of sensitivity to other agents under investigation.
Acknowledgments
This work was funded by Research Councils (GR/s23483), BBSRC (75/E19292), AICR (00-292) and SBRI (19666).
References
Albota, M., Xu, C., and Webb, W. (1998). Two-photon fluorescence excitation cross sections of biomolecular probes from 690 to 960nm. Appl. Opt. 37, 7352-7356.
Bell, D. H. (1988). Characterization of the fluorescence of the antitumour agent, mitoxantrone. Biochim. Biophys. Acta 949, 132-137.
Bestvater, F., Spiess, E., Strobrawa, G., Hacker, M., Fuerer, T., Porwol, T., Berchner-Pfannschmidt, U., Wotzlaw, C., and Acker, H. (2002). Two-photon fluorescence absorption and emission spectra of dyes relevant for cell imaging. J. Microsc. 208, 108-115.
Darzynkiewicz, Z., and Kapuscinski, J. (1990). Acridine orange: A versatile probe of nucleic acids and other cellular constituents. In "Flow Cytometry and Sorting" (M. R. Melamed, T. Lindmo, M. L. Mendelsohn, eds.), pp. 291-314. Wiley-Liss, New York.
Denk, W., Piston, D. W., and Webb, W. W. (1995). Two-photon molecular excitation in laser scanning microscopy. In "Handbook of Biological Confocal Microscopy" (J. B. Pawley, ed.), pp. 445-458. Plenum Press, New York.
Errington, R. J., Ameer-Beg, S. M., Vojnovic, B., Patterson, L. H., Zloh, M., and Smith, P. J. (2005). Advanced microscopy solutions for monitoring the kinetics and dynamics of drug-DNA targeting in living cells. Adv. Drug Deliv. Rev. 51,153-167.
Frey T., Yue S., and Haugland, R. P. (1995). Dyes providing increased sensitivity in flow-cytometric dye-effiux assays for multidrug resistance. Cytometry 20, 218-227.
Frey, T. (1995). Nucleic acid dyes for detection of apoptosis in live cells. Cytometry 21, 265-274.
Lakowicz, J., Gryczynski, I., Malak, H., Schrader, M., Engelhardt P., Kano, H., and Hell, S. (1997). Time-resolved spectroscopy and imaging of DNA labelled with DAPI and Hoechst 33342 using three-photon excitation. Biophys. J. 72, 567-578.
Latt, S. A., and Langlois, R. G. (1990). Fluorescent probes of DNA microstructure and DNA synthesis. In "Flow Cytometry and Sorting" (M. R. Melamed, T. Lindmo, and M. L. Mendelsohn, eds.), pp. 249-290. Wiley-Liss, New York.
Lown, J. W., Morgan, A. R., Yen, S.-R, Wang, Y. H., and Wilson, W. D. (1985). Characteristics of the binding of the anticancer agents mitoxantrone and ametantrone and related structures to deoxyribonucleic acids. Biochem. J. 24, 4028-4035.
Morgan, S. A., Watson, J. V., Twentyman, P. R., and Smith, P. J. (1990). Reduced nuclear binding of a DNA minor groove ligand (Hoechst 33342) and its impact on cytotoxicity in drug resistant murine cell lines. Br. J. Cancer 62, 959-965.
Smith, P. J., Blunt, N., Wiltshire, M., Hoy, T., Teesdale-Spittle, P., Craven, M. R., Watson, J. V., Amos, W. B., Errington, R. J., and Patterson, L. H. (2000). Characteristics of a novel deep red/ infrared fluorescent cell-permeant DNA probe, DRAQ5, in intact human cells analyzed by flow cytometry, confocal and multiphoton microscopy. Cytometry 40, 280-291.
Smith, P. J., Lacy, M., Debenham, P. G., and Watson, J. V. (1988). A mammalian cell mutant with enhanced capacity to dissociate a bis-benzimidazole dye-DNA complex. Carcinogenesis 9, 485-490.
Smith, P. J., Wiltshire, M., Davies, S., Patterson, L. H., and Hoy, T. (1999). A novel cell permeant and far red-fluorescing DNA probe, DRAQ5, for blood cell discrimination by flow cytometry. J. Immunol. Methods 229, 131-139.
Van Zandvoort, M., de Grauw, C., Gerritsen, H., Broers, J., oude Egbrink, M., Ramaekers, E, and Slaaf, D. (2002). Discrimination of DNA and RNA in cells by a vital fluorescent probe: Lifetime imaging of SYTO13 in healthy and apoptotic cells. Cytometry 47(4), 226-235.
Waggoner, A. S. (1990). Fluorescent probes for cytometry. In "Flow Cytometry and Sorting" (M. R. Melamed, T. Lindmo, M. L. Mendelsohn, eds.), pp. 209-225. Wiley-Liss, New York.
White, N. S., and Errington, R. J. (2002). Multi-photon microscopy: Seeing more by imaging less. Biotechniques 33(2), 298- 305.
Williams, R. M., Zipfel, W. R., and Watt, W. W. (2001). Multi-photon microscopy in biological research. Curr. Opin. Chem. Biol. 5, 603-608.
Zalewski, P. D., Forbes, I. J., and Betts, W. H. (1993). Correlation of apoptosis with change in intracellular labile Zn(II) using zinquin [(2-methyl-8-p-toluenesulphonamido-6-quinolyloxy)acetic acid], a new specific fluorescent probe for Zn(II). Biochem J. 296, 403-408.
Support our developers


