Micromanipulation of Chromosomes and the Mitotic Spindle Using Laser Microsurgery (Laser Scissors) and
Laser-Induced Optical Forces (Laser Tweezers)
I. INTRODUCTION
Individual chromosomes in living cells can be manipulated by optical scissors and optical tweezers. Early experiments (Berns et al., 1969) demonstrated that a low power-pulsed argon laser focused onto chromosomes of living mitotic salamander cells resulted in the production of a 0.5-µm lesion in the irradiated region of the chromosome. In these studies, the chromosomes were photosensitized with a low concentration of the vital dye acridine orange. Subsequent studies on salamander and rat kangaroo cells (PTK2) indicated that the laser microbeam could be used to selectively inactivate the nucleolar genes (Berns, 1978). Using the 266-nm wavelength of a Nd:YAG laser, not only could the nucleolar genes be selectively deleted, causing a loss of nucleoli in the subsequent cell generation, but also a corresponding lack of one lightstaining Giemsa band in the nucleolar organizer region of the chromosome could be demonstrated in cells descended from the single irradiated cell (Berns et al., 1979). With the further development of cloning techniques specific for single irradiated cells, cellular sublines with deleted ribosomal genes resulting from laser microbeam irradiation of the rDNA on the mitotic chromosome were established (Liang and Berns, 1983). In more recent studies it has been possible to use a picosecond laser to induce two-photon ablation of the ribosomal genes (Berns et al., 2000). These studies confirmed the earlier suggestion that short pulsed green lasers could be used to produce nonlinear multiphoton effects on cellular organelles (Calmettes and Berns, 1982). This nonlinear multiphoton effect was also demonstrated by Tilapur and Konig (2002) using a femtosecond laser to transiently disrupt the outer cell membrane.
In addition to the selective manipulation of chromosomes for both genetic studies and studies on chromosome movements during mitosis, pulsed lasers have been used to alter mitotic spindle structures such as centrosomes, microtubules, and chromosome kinetochores (see Berns et al., 1981). A major advance in subcellular irradiation occurred in 1997 when Khodjakov et al. (1997) described the use of green fluorescent protein (GFP) to light up microtubules and centrosomes in live cells so that these organelles could be selectively targeted. The advent of the use of GFP and its mutant constructs has become a major additive tool to laser microscopy because it permits visualization and targeting of a large number of cell structures and molecules in living cells that were not visualized and targeted easily with either conventional light or fluorescence microscopy.
In 1987, Ashkin and colleagues first used a tightly focused laser beam to generate optical trapping forces to move biological objects. The manipulation of chromosomes in living cells and in isolation buffer was reported by Berns et al. (1989). In this study, laser optical tropping force was applied to metaphase chromosomes in order to study the generation of forces within the mitotic spindle. (Liang et al., 1991). The combination of laser cutting and laser tweezers was demonstrated by Wiegand-Steubing et al. (1991). The combined scissors and tweezers system was used for the fusion of two different mammalian cells and subsequently for chromosome cutting and trapping (Liang et al., 1993, 1994). Several good review articles on the use of laser ablation and laser traps should be consulted for a broader overview of this field and these technologies (Weber and Greulich, 1992; Berns et al., 1998; Schutze et al., 2002). Biologists now have a more complete set of optical tools to manipulate cells and their internal structures such as chromosomes and other structures involved in organelle movement.
II. MATERIALS AND INSTRUMENTATION
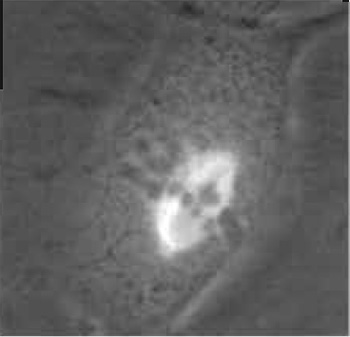 |
| FIGURE 1 Dual-phase contrast and fluorescence image of a live PTK2 (rat kangaroo, Potorous tridactylis) cell in mitotic metaphase. The phase-dark chromosomes are aligned at the metaphase plate. Spindle microtubules contain the yellow fluorescent protein (YFP) variant of green fluorescent protein (GFP). Spindle microtubules can be seen attaching to the chromosomes and converging at each pole. See Fig. 7 for laser ablation of a microtubule bundle and transmission electron micrograph of the lesion in this cell. |
Rat kangaroo (Potorous tridactylis) kidney cells PTK2 or PTK1 are well suited for these studies because they have a low chromosome number (12-13) and they remain very flat throughout the entire cell cycle, allowing visualization of cytoplasmic and mitotic structures under phase, fluorescence, or DIC microscopy. The cells can be either standard lines available from the American Type Culture Collection (ATCC-CCL 167) or special sublines that have been transfected to express GFP or genetic variants of the GFP that absorb and emit wavelengths in other regions of the spectrum (Fig. 1).
B. Media, Chemical, and Supplies for Cell Culture
Modified Eagle's medium (Cat. No. 410-1500 ED), penicillin-G (Cat. No. 600-5140AG) 100 units/ml (working concentration for experiment, same as follows), streptomycin sulfate (Cat. No. 600-5140AG) 100µg/ml, trypsin (Cat. No. 610-5050AJ) 0.25%, L-glutamine (Cat. No. 320-5030AJ) 2mM, pancreatin (Cat. No. 610-5720AG), phenol red (Cat. No. 15-100- 019), (phosphate-buffered saline) (PBS) without Ca2+ and Mg2+ (Cat. No. 310-4200), colcemid (Cat. No. 120- 5210AD), and fetal bovine serum (Cat. No. 230-6140AJ) are from GIBCO. EDTA (Cat. No. 34103) and piperazine- N,N'-bis-2-ethane sulfonic acid monosodium monohydrate (PIPES) (Cat. No. 528132) are from Calbiochem. CaCl2 (Cat. No. 07902) is from Sigma. Hexylene glycol (2-methyl-2,4-pentanediol) (Cat. No. 1134329) is from Eastman Chemical. Culture flasks T25 (Cat. No. 25106) and T150 (Cat. No. 25126) are from Corning. Centrifuge tubes, 15ml (Cat. No. 2097) and 50ml (Cat. No. 2098), are from Falcon. Hemacytometer "Bright Line" (Cat. No. B3180-2) is from Baxter. Centrifuge Dynac II is provided by Clay Adams.
C. Cell Culture Chambers
Chamber tops and bottoms, screws, sterile gaskets, sterile needles, and sterile syringes are components of the multipurpose culture chamber (see Fig. 2). For perfusion of cells with an exogenous agent during or immediately following laser exposure, the exit needle may be coupled to an empty receiving syringe or some other receptacle. The compounds and agents to be applied to the cells are in the injection syringe.
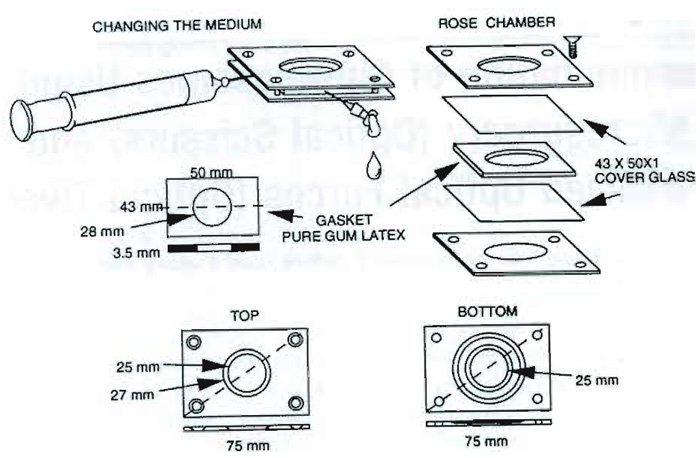 |
| FIGURE 2 Multipurpose cell culture chamber with its component parts (investigators may use any of a number of different cell chambers that are specifically adapted for their experiments). |
D. Lasers and Microscopy
The lasers and connecting optical system may be interfaced with either an upright or inverted microscope of any major microscope manufacturer. Historically, we have used Zeiss microscopes of various types (upright photomicroscope, inverted Axiomat, Universal M). The current system is built around an inverted Zeiss axiovert $100 microscope (Fig. 3). The mercury arc lamp was moved distally from the epi-illumination optics to accommodate a beam splitter (BS) to combine arc lamp illumination and the laser-trapping beam. A dual-view image module (not shown) and a Quantix Q-57 back-thinned, cooled CCD are mounted on a camera port of the microscope. Microscope risers (not shown) raise the microscope to access the underneath "Keller" port.
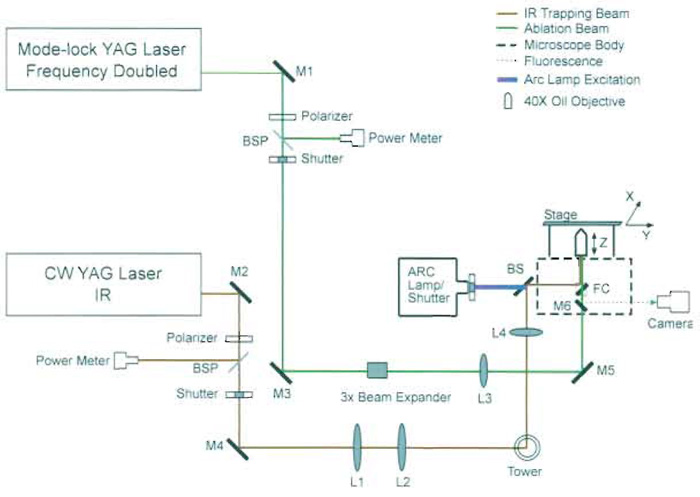 |
| FIGURE 3 Schematic diagram of optical scissors and optical tweezers. M1-M6, mirrors; L1-L4, lenses; BSP, beam samplers; FC, filter cube; BS, beam splitter. Lasers from a variety of manufacturers may be used (see discussion in text). The YAG laser trapping beam can be divided into several beams that are reflected off of different motor-driven mirrors, resulting in multiple individually controlled trapping beams (Berns et al., 1998). |
Two different laser systems are used for the cutting scissors beam. Both systems generate 532-nm green light by frequency doubling of the primary 1064-nm wavelength. One system is a Coherent Inc. modelocked Antares Nd:YAG laser at a repetition rate of 76MHz with a pulse duration of 100ps (1064nm) and 80ps (532nm). The other cutting system is a Spectra- Physics Inc. mode-locked Vanguard laser with a repetition rate of 76MHz and a pulse duration of 10ps at 532nm.
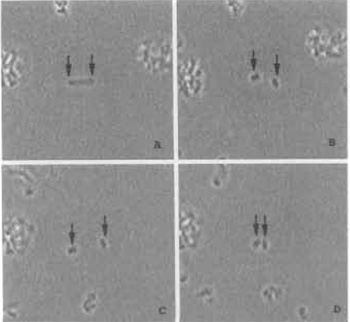 |
| FIGURE 4 Model illustrating laser trapping and cutting of chromosomes in suspension. (A) A single chromosome is held in position using two different laser traps to hold each end of the chromome in the horizontal optical plane of the microscope field (arrows). (B) Two chromosome pieces immediately after being cut with the laser scissors beam; each piece is being held by a laser trap. (C) The two laser traps are used to move the two chromosome pieces apart. (D) The laser traps are used to move both chromosome pieces toward each other. Chromosome width is 2 µm. |
Two different trapping lasers have been used: a Spectra-Physics Millenia IR continuous mode ND:YVO4 laser at 1064nm, with a maximum power of 10W, and the primary 1064 wavelength of the pulsed Antares Nd:YAG laser operating at 76MHz. The maximum power of the Antares laser is 18 W. For either laser, the actual power entering the microscope for the trapping experiments is 1-2W, and the average power at the objective focal point in the sample is 10-300mW. The high power of the primary output beam allows for splitting the beam into two beams (not shown in Fig. 3) so that multiple collinear trapping beams can be reflected off of precision motor-drive mirrors and directed into the microscope (Berns et al., 1998). This permits simultaneous application of forces on either different objects in the same microscope field or different points on the same object (Fig. 4). The 1064-nm wavelength has the beneficial properties of low water absorption and relatively good cell viability following exposure to the trap. Also, there is a particularly good cellular optical "window" for trapping at 800-820nm and a lethal window at 740-750nm (Vorobjev et al., 1993; Liang et al., 1996). Additionally, diode lasers are now available in useful wavelength ranges for optical trapping. They are more compact and less costly than the large YAG laser systems.
The cutting and trapping laser beams are sampled by partial reflection off a beam sampler (BSP) and monitored with a photodiode power meter. Power control is achieved with Glan polarizers in a motorized rotary mount. The two laser lines are shuttered individually with a minimum exposure time of 3 ms using a mechanical shutter. It should be mentioned that the lasers described earlier are just a few of many different types and models available from several different companies. Investigators may chose from a wide variety of different laser systems depending on individual investigator needs.
Two two-phase dual axis stepper motors operate the x,y microscope stage with several micrometer resolution. The stage is driven by a National Instruments stepper motor driver and a flex-motion PXI motion controller.
1. Microscope and Microscope Modifications
- A Zeiss Axiovert $100 inverted microscope with a motorized stepper motor stage (joystick controller) and motorized stepper motor for fine focus. A Ph3 Neofluar 40X, 1.3 NA or 63X, 1.4 NA oil immersion microscope objective lens is used.
- Microscope risers (not shown) are used to lift the microscope 4.25in. above the table for access to the underneath Keller port.
- A RS-170 format CCD camera (SONY) for highresolution, video frame rate imaging of the specimen is used. A Ropert Scientific Quantex Q-57 back-thinned and cooled CCD is used for low-light imaging of fluorescence.
- An Optical Insight's dual view system is used for simultaneous imaging of two spectral bands on the Q- 57 camera (not shown).
- A modified epi-illumination light path is used whereby the arc lamp is removed from the Zeiss epiillumination lens system and mounted 4in. away. A motorized shutter system (Vincent Associates) to shutter arc lamp illumination is used.
- A short-pass dichroic BS centered at 1064nm to combine the visible spectrum from the arc lamp with the IR trapping beam is used.
- Customized fluorescent filter cubes (FC) with exciters and dichroic beam splitters designed to pass/reflect both the excitation band and a narrow band around the IR laser (centered at 1064nm) are used.
2. Laser Interfaces with Microscope
- Both the laser scissors and tweezers have their own variable attenuator to control laser power external to the main laser cavity. The attenuator, consisting of a glan laser linear polarizer (CVI Laser, LLC), is mounted in a stepper motor rotational mount (National Instruments) with motion driver and motion control hardware/software (National Instruments) to automate laser power contol.
- Both laser lines pass through their own beam sampler (BSP) (CVI Laser, LLC), which reflects a small percentage of the attenuated laser beam toward a large area photodetector power meter (New Focus). The detector outputs a voltage proportional to the average power of the attenuated beam.
- Both laser lines have a motorized shutter placed beyond the beam sampler and share a shutter driver with either RS-232 or TTL control (Vincent Associates). The IR shutter is controlled by a button on the joystick.
- The 532-nm laser is expanded with a 3X beam expander (Newport) and is focused into the image plane of the Keller port with a f = 300-mm pianoconvex lens, L3.
- The 1064 laser is expanded with a custom-made 4X beam expander consisting of a f = 25.4-mm pianoconvex lens, L1, and a f = 100-mm piano-convex lens, L2, which is mounted to allow axial displacement and thus control of divergence from a collimated beam for the purpose of focusing the laser relative to visible light in the microscope objective. The expanded beam is focused at the back focal plane of the Zeiss epifluorescent lens system, after reflection off of BS, with a f = 150-mm biconvex lens, L4.
- An IR finder scope (FJW Optical Systems, Inc.) and an infrared sensor card (Coherent) are used for detecting and monitoring the IR laser. Some commercial home-use camcorders have a "night vision" mode, which will also visualize scatter of the beam. Please note that the finder scope or camcorder should never directly visualize the beam, only the scatter from optical elements.
- A computer with appropriate software for recording images, controlling stepper motors, and controlling the shutters is used. A VCR or digital video recorder captures the RS-170 signal at video frame rates.
III. PROCEDURES
A. Preparation of PTK2 Dividing Cells in Culture Chamber
Solution
0.125% viokase solution: To make 100ml, dissolve 5 ml of pancreatin, 0.1 g of EDTA, and 0.25 ml of phenol red into 95 ml of PBS without Ca2+ and Mg2+, adjust PH to 7.4.
Steps
- Select a healthy, confluent or nearly confluent flask of cells.
- Remove the old medium from the flask of cells using an unplugged sterile pipette attached to a vacuum flask.
- Add 1.0ml of viokase solution to the flask of cells.
- Place the flask of cells with viokase in the 37°C incubator for 7-10min. When the cells begin to lift free from the flask, rap the flask sharply two or three times to dislodge the cells completely.
- Add 5 ml MEM to inactive the viokase and wash any adhering cells free.
- Transfer the medium, viokase, and cell mixture to a sterile centrifuge tube.
- Centrifuge the cell suspension for 4-Smin at 800-1000 rpm.
- After centrifugation, carefully remove the stopper from the tube and very carefully aspirate the supematant from the tube.
- Resuspend the cell pellet in the drop remaining in the tube bottom.
- Add 5ml of MEM to the resuspended pellet and count a sample onto a hemocytometer. Count all four corners (i.e., four groups of 16 squares each), divide the result by 4, and multiply by 104 . This gives the concentration of cells per milliliter of resuspended material.
- Adjust the cell concentration to give 2.5-3.5 × 10⁴ cells/ml and inject these into the chambers using a sterile syringe and 23-gauge needle (see Fig. 2)
- Incubate the chambers (cell side down) at 37°C in a 5-7.5% CO2 incubator. After 36-60 h, select chambers with dividing cells for experimentation.
B. Transfected Cell Lines
Generation of cell lines stably expressing fluorescent protein fusions of human α-tubulin were generated by amphotropic retroviral infection. The following procedures were used to generate two GFP mutants specific to our studies: yellow fluorescent protein (YFP) and cyan fluorescent protein (CFP). Investigators may use other methods to generate fluorescent genetic constructs specific to their needs
- Excise the human α-tubulin cDNA fused at its N terminus to the enhanced yellow variant of green fluorescent protein (YFP) from a commercially available plasmid (Clontech) via an AfeI/MfeI digest.
- Ligate this fragment into the SnaBI/EcoRI sites of pBABEbsd, a retroviral vector based on pBABEpuro with a blasticidin resistance marker.
- Generate the cyan version of the tubulin fusions (CFP-α-tubulin) by insertion of the α-tubulin cDNA into the CFP-C1 vector (Clontech) and then excise by AfeI/MfeI and insert into pBABEpuro.
- Cotransfect the retroviral plasmids containing the fluorescent protein-tubulin fusions into 293-GP cells (a human embryonic kidney cell line harbouring a portion of the murine Moloney leukemia virus genome) along with a VSV-G pseudotyping plasmid to generate amphotropic virus.
- Forty-eight hours after transfection, collect, filter, and place the tissue culture supernatant into a subconfluent culture (30-40%) of PTK2 cells in 35-mm dishes.
- Forty-eight hours after infection, split and replate cells in 10-cm dishes and subject to selection in 100µg/ml puromycin (CFP-tubulin) or 10µg/ml blasticidin (EYFP-tubulin) for 14 days.
- Select high expressors (top 10%) by fluorescenceactivated cell sorting (FACS).
C. Alignment of Laser Microbeam System
-
See Fig. 3 for a diagram of the system.
1. Aligning, Expanding, and Focusing the Trapping Beam
- The key to bringing a laser into the microscope is to use the built-in light path of the microscope to define the optical axis outside of the microscope. With proper Köhler alignment and a 10X objective, close down the field aperature and insert a filter set with a deep red reflector. The narrow beam of light (from the halogen lamp of the microscope) emitting from the epi-illumination lens system will define the optical axis. Two iris diaphragms (not shown) are placed along the light path to define the optical path of the microscope. The laser is brought into the microscope so that it is centered within the same irises, thus aligning it with the optical axis.
- The laser beam must be expanded to employ the full numerical aperture of the 40x NA1.3 objective lens. Mount lens L2 first and ensure that the beam is still aligned with the optical axis. Repeat procedure with lens L2, also ensuring that light emanating from L2 is collimated. Note that light emitting from the objective turret (with no objective in place) is not focused to infinity.
- A third lens, L4, was added to the light path to collimate light through the objective turret. Remove the 40x objective and leave the turret empty. Position L4 until light from the turret is parallel, i.e., neither converging nor diverging.
- Put a culture chamber with test sample under the microscope and bring into focus. Five- to 10-pm diameter beads (of polystyrene or other suitable material) make useful targets for fine-tuning the laser trap.
- Slightly defocus the laser beam toward the specimen side. The bright spot of the laser beam will appear on the screen of the video monitor. Draw a cross with an erasable marker pen at the bright spot on the screen. The trap is now coincident with the cross hair on the monitor screen. Alternatively, a computer- generated cross hair can be positioned on the screen.
- By mounting lens L2 in a z-translation mount, the relative focus between the image plane and the laser trap can be adjusted.
2. Alignment of Scissors Beam
- As with the trapping beam, use the built-in light path of the microscope to define the optical axis outside of the microscope. With proper Köhler alignment and a 10X objective, close down the field aperture. Remove any fluorescent filter sets from the microscope stand so that light will exit the microscope via the underneath "Keller" port. The narrow beam of light (from the halogen lamp of the microscope) emitting from the Keller port will define the optical axis.
- Two iris diaphragms (not shown in Fig. 2) are placed along the light path (at least 12-14in. of separation between them). If the laser is brought into the microscope so that it is centered within the same irises, then the laser will be aligned and parallel to the optical axis of the microscope.
- The laser beam must be expanded to employ the full numerical aperture (NA) of the 40 and 63X objective lenses. Place the 3X BS in the optical path using an adjustable mount and the irises to ensure that the laser beam is parallel and runs along the optical axis of the microscope.
- Remove the 40x objective and leave the turret empty. Position L3 until light from the turret is parallel, i.e., neither converging nor diverging.
- Put a culture chamber with a test sample under the microscope and bring it into focus.
- Ensure that on the monitor the scissors beam coincides with the cross hair of the trapping beam. If not, carefully adjust L3 until it does. The laser scissors and tweezers are now aligned.
3. Microsurgery of Chromosomes and Cell Cloning 1
1 The cloning procedure just described is one that we have found useful. However, with recent developments in microfluidics and nanotechnology, these technologies may be used for cell isolation and cloning.
- After alignment of the laser microbeam, place a dried smear of red blood cells under the microscope objective and locate a monolayer region. The blood smear should be made on a cover glass, which may either be the bottom glass of a cell chamber (see Fig. 1) or be a cover glass that is simply mounted on a regular microscope slide with the red blood cell surface facing the slide so that the laser beam passes through the cover glass before contacting the red blood cell. Fire a burst of pulses of the laser beam on the red blood cell to produce a small hole (<1 µm) to verify that the cross hair on the TV screen is directly over the lesion. If the hole is too large, attenuate the laser output until a small threshold lesion of 0.25-0.5 µm is produced. For a high-quality single mode laser beam, this small threshold lesion spot represents the center of the laser beam Gaussian profile.
- Remove the red blood cell slide and place the experimental sample under the microscope.
- Select dividing cells that appear healthy. For PTK2 cells the cytoplasm should be free of vacuoles and the cells well flattened. The nuclear envelope and mitochondria should be clearly resolvable in interphase cells. In mitotic cells the chromosomes are dark when viewed under phase-contrast microscopy, and spindle micrtotubule bundles are clearly visible using fluorescence microscopy (Figs. 1 and 7).
- The mitotic stage of dividing cells should be determined by the specific needs of the experiment.
- Move the microscope stage so that the specific
target site of the selected chromosome is under the
cross hair on the monitor screen.
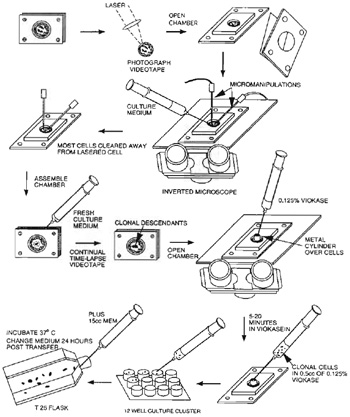
FIGURE 5 Diagram of the procedures for cloning single
cells that have been irradiated at a specific chromosomal
site. A variety of individualized procedures and
technologies may be used depending on the investigator
and laboratory needs. - Fire the laser on the selected chromosome site. Gradually increase the laser power until a lesion appears. At the lesion-threshold energy density (nJ/µm2), the lesion will appear as a small phase lightening at the point of laser focus. As the threshold energy density is surpassed, a phase-dark spot may appear in the center of the lesion, and at highest energy densities the chromosome can actually be cut into fragments (Fig. 4). Although the precise physical mechanisms of the laser ablation are not fully understood, it seems likely that multiphoton absorption and other nonlinear processes, such as plasma-induced cavitation bubbles and stress waves, are occurring in the laser focal volume (Vogel and Venugopalan, 2003).
- Videotape the entire experiment or acquire images using a digital camera and a computer frame grabber. Record the image before and after irradiation. In the case of genetic studies, the irradiated cell may be isolated and cloned into a viable population using either a laboratory-specific cloning procedure or a procedure similar to steps 8 to 12 (see Fig. 5).
- Under sterile conditions, remove nonirradiated cells from near the target cell using a micromanipulator.
- Reseal the cell culture chamber.
- Check the chamber at 12h, and use the 532-nm laser beam to ablate cells migrating into the area of the cell being followed.
- Monitor the proliferation of the target cell using the acquired images or simply by observation.
- Collect descendent clonal cells by 0.125% viokase solution and then transfer into 1 well of a 12- well culture cluster containing normal medium. 13. Collect clonal cells with the 0.125% viokase solution until they are confluent and transfer them into a T25 culture flask.
- When the proliferation of descendent clonal cells reaches a sufficient number they can be subjected to standard karyotypic and/or biochemical analysis. Additionally, selective regions may be cut from the chromosomes and subjected to polymerase chain reaction, gene cloning, and analysis (Shutze et al., 2002; He et al., 1997).

4. Optical Trapping of Chromosomes
- Place a culture chamber under a microscope that contains either live dividing cells or chromosomes suspended in isolation buffer.
- Select a specific chromosome under the microscope for experimentation.
- In the case of a living cell, flat and large cells are especially good for micromanipulation. The selection of the mitotic stage depends on the specific goal of the experiment.
- Locate the specific site of the selected chromosome at the cross hair on the monitor screen.
- Open the shutter, allowing the trapping beam to enter the microscope. The trapping laser is focused at the prealigned site, which is located in the image plane of the microscope objective.
- The chromosome near the focal point of the trapping beam will be drawn into the focal point.
- Move the specimen stage at a speed less than 25 µm/s in the desired direction. The chromosome will be held at the trapping position. (Usually the sites on which the largest trapping force can be applied are at either ends of the chromosome.)
- If the trapping force is not large enough to hold the chromosome, increase the power of the trapping beam by rotating the polarizer. (The trapping force is linearly proportional to the incident power of the trapping beam.)
- Either videotape or digitally record the experiment. Individual digital should be acquired with the frame grabber. Record data before, during, and after manipulation by the optical trapping force.
- The laser trap can be combined with the laser scissors. A chromosome can be held in the trap while the cutting (scissors) laser is used to cut it into fragments, each of which can be moved by laser traps (Fig. 4).
5. Irradiation of Mitotic Spindle
- Because of low light levels from fluorescent structures, a sensitive digital camera is used for these experiments (Q-57 camera). Images are acquired using the computer frame grabber and are displayed on the computer monitor. Place a dried smear of red blood cells under the microscope objective and locate a monolayer region. Fire a series of pulses of the ablation laser beam on the red blood cells to produce a small hole (<1µm) to locate the laser focus while viewing on either the computer screen or the video monitor. Either mark cross hairs on the computer monitor to determine the focus location or note the pixel coordinates on the screen. A computer-generated cross hair may also be used to denote the point of laser focus.
- Place a culture chamber under the microscope that contains either YFP or CFP microtubuletransfected cells.
- Locate a cell in the desired stage of the cell cycle. This will depend on the nature of your experiment.
- Move the stage to position the desired target under the cross hairs or onto the laser scissors pixel location.
- Remove the fluorescent filter set by sliding the fluorescent slider to an empty position and push in the lever of the microscope stand to open the Keller port.
- Open the shutter for a 3-ms pulse and immediately slide the appropriate filter set into place.
- Acquire and save images before and after each ablation (Fig. 7)
6. Single Cell Serial Section Transmission Electron Microscopy
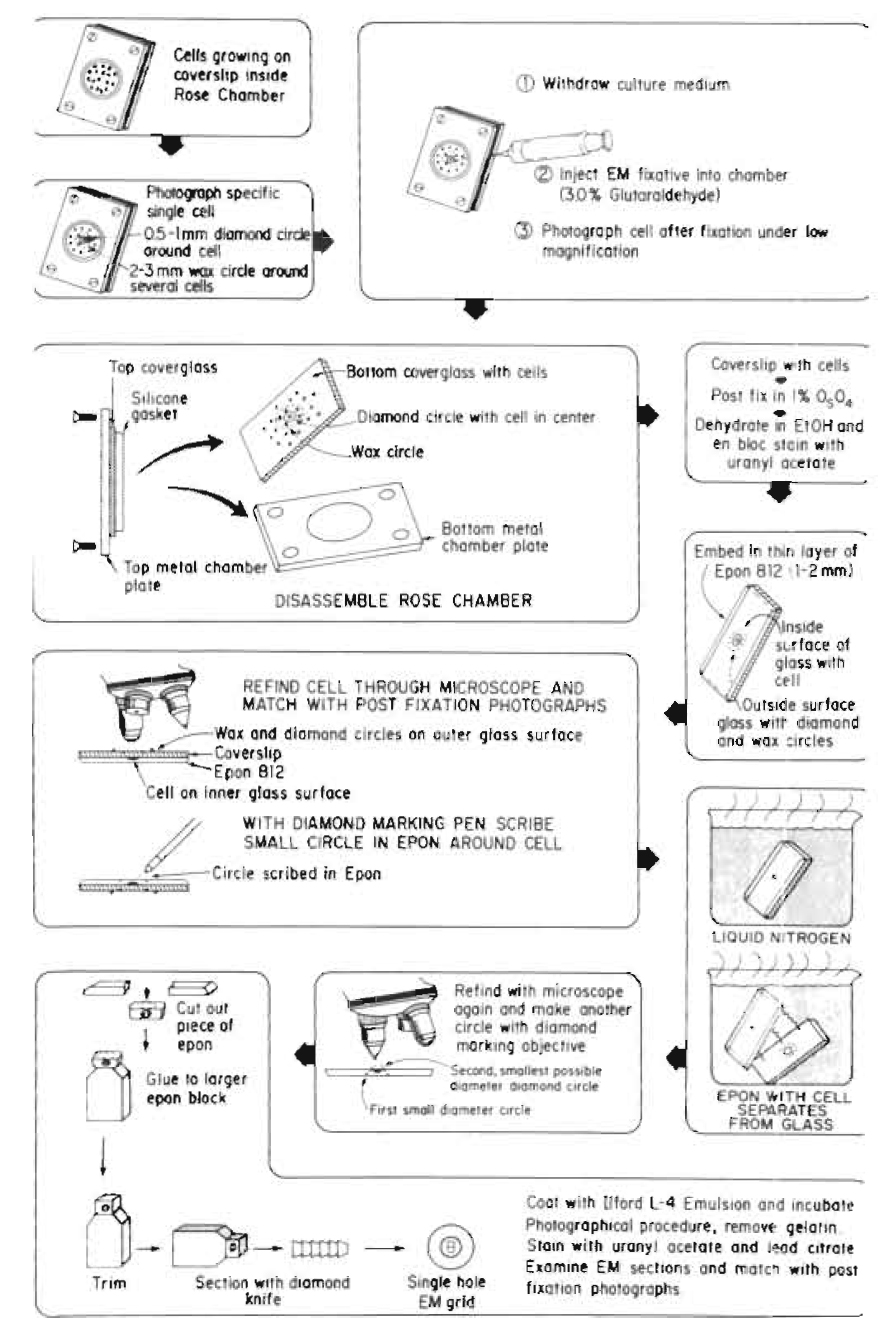 |
| FIGURE 6 Diagram of the procedures used for single cell electron microscopy resulting in the recovery and observation of the laser-irradiated cell and organelle (see Fig. 7). This series of procedures was originally developed for EM autoradiography, thus the last step may not be needed in specific studies. |
This is a very useful, but tedious, technique that allows precise ultrastructural definition of the nature and extent of laser damage at the sublight microscope level (Figs. 6 and 7). These methods may be adapted to individual investigator needs and vary between laboratories (Rattner and Berns, 1974; Liaw and Berns, 1981; Khodjakov et al., 1997).
- Allow cells inside the culture chamber to become nearly confluent.
- Insert one 23-gauge needle into the gasket on each side of the culture chamber; one for withdrawing culture medium and one for injecting Karnofsky fixative into the chamber. Bend the exit needle to approximately a 30° angle and attach a 5-ml syringe without a plunger. Attach the input needle to a 20-in.-length of i.d. 0.63-mm, o.d. 1.19-mm, silastic laboratory tubing (Fisher Scientific) coupled to a 10-ml syringe containing fixative. Attach a Nalgene polypropylene pinch clamp (Fisher Scientific) to the tubing between the syringe and the needle in order to prevent flow of any fixative into the chamber.
- Photograph or digitally store at high and low magnification images of single cells selected for irradiation.
- Perform the laser irradiation experiment.
- Inject Karnofsky fixative into chamber immediately after irradiation.
- Photograph/digitally store image of irradiated cell at high and low magnification.
- While on the microscope stage, etch a 0.5-mm circle around the region containing the cell using a Carl Zeiss (Germany) diamond marking objective. This provides an etched circle that will be used for subsequent relocation of the irradiated cell. In addition, draw a 1- to 2-mm circle around this circle using either a wax pencil or a water-resistant felt-tip marking pen. This facilitates rapid location of the etched circle.
- Wash the chamber (while still assembled) with saline.
- Inject flesh Karnofsky fixative into the chamber.
- After 30min in fixative, remove the solution and inject the chambers with cacodylate buffer.
- Place the chamber back under the microscope where the irradiated cell is relocated and digitally record under 63 and 10X magnification.
- Change buffer, disassemble culture chamber, and put the bottom cover glass, which includes cells, diamond circle, and ink mark circle, in a petri dish with cells side up for embedding.
- Postfix in 1% Os O4, en bloc stain with uranyl acetate, dehydrate in ETOH, and embed in a 1- to 2-mm thin layer of Epon/Bed 812.
- With a diamond marking pen, scribe a small circle on the plastic side matching the exact site of the diamond circle/ink circle on the cover glass.
- Remove cover glass from plastic with cell by dipping the cover glass/plastic into liquid nitrogen. The differential contraction and expansion of the two materials result in the plastic containing the cells to separate cleanly from the glass.
- From the nonscribed side of plastic, relocate the irradiated cell inside the new diamond pen scribed circle through the microscope and match with postfixation photographs. Make a smallest possible circle with the diamond marking objective around the cell. Make a square ink mark around the circle.
- Cut out the piece of plastic along the square ink mark and glue onto a blank embedded plastic block with diamond circle side up.
- Carefully trim the block face to include the irradiated cell. Take extra attention to align the knife and block face to get the perfect whole block face at first section as possible.
- Serial section in 60nm thick and place sections on 1 x 2-mm Formvar-coated slot EM grids in order. The linear ribbon of the sections will help keep sections and grids in perfect order. The slot grid will not obscure the specific cell.
- Stain with uranyl acetate and lead citrate.
- Examine sections through TEM. Match with postfixation images to find the irradiated cell/organelle.
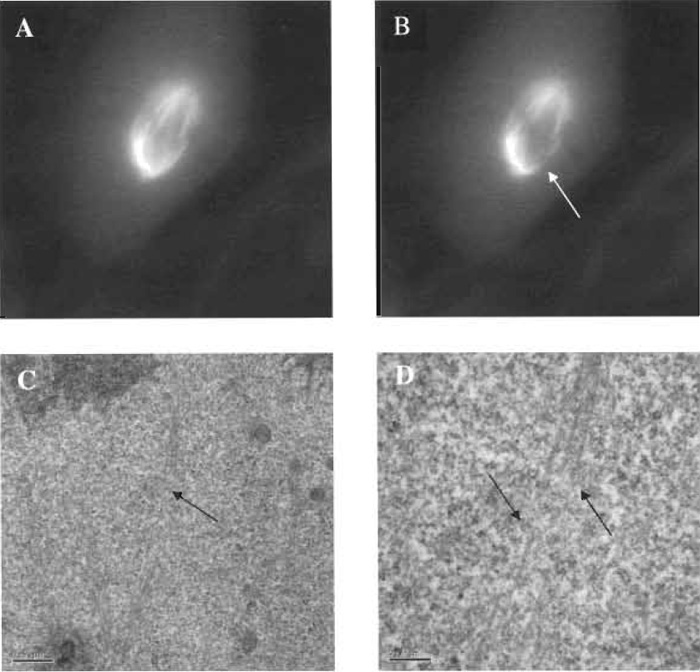 |
| FIGURE 7 Fluorescent images of a PTK2 cell containing yellow fluorescent protein in the tubulin of metaphase microtubules. A microtubule bundle extending from the mitotic pole (centrosome region) to a single chromosome has been cut with the laser scissors, and the specific cut region has been imaged by electron microscopy. (A) Fluorescent microtubule spindle prior to laser exposure. (B) Microtubule bundle cut (arrow) using 0.5nJ/pulse of the laser scissors; total energy needed to cut the bundle was 610µJ/µm2. (C) Low-magnification transmission electron micrograph (TEM) illustrating cut zone (arrow). (D) High-magnification TEM illustrating cleanly cut microtubule in the region corresponding to the loss of fluorescence following laser exposure (see image "B"). Note that individual microtubles that have been cut/ablated continue intact on either side of the ablation zone (arrows). Scale bar: 0.2µm. |
IV. COMMENTS
The procedures described in this article, by in large have either been specifically developed for use in the authors laboratories or have been developed as a result of many years (1980-2004) of collaborations with investigators who have used the NIH LAMMP Biotechnology Resource at the Beckman Laser Institute, Irvine, California. Thus, many of the procedures have evolved over the years and have been adapted to new technologies and to many different needs of the collaborating investigators. Also, as noted throughout this article, many of the precise methods can be modified and adapted further to specific needs of experimenters and laboratories. We would rather consider the procedures and techniques that we have described as precise guidelines as opposed to hardand- fast protocols. Where possible, we have used very simplistic language so as to make execution and duplication of the procedures as simple as possible.
V. PITFALLS
- Variation in laser output power can cause inconsistent experimental results. Turn on the lasers 30min to 1h before the experiment and continue to monitor the output power throughout the laser experiments. Laser power/energy may vary as much as 20-30% during the day and may be particularly affected by changes in environmental temperature, which subsequently can cause very small changes in intercavity mirror alignments. Temperature can also affect optical alignments on vibration tables and in the microscope. All of these changes can affect the amount of energy in the focused laser spot and therefore the results of the experiment. It is suggested that laser output power and energy in the microscope focal point be checked periodically as well as before and after the experiment.
- Living cells will be damaged if exposed to the laser beam either for long periods of time or at too high irradiances. The average power <200mW for the trapping beam and energy in the nJ- µJ/pulse in the focused spot for the scissors beam are recommended as exposure parameters. However, these are only rough guidelines, as the lasers now available have pulse durations in the femtosecond regime. The mechanisms of interaction of these short-pulse systems are not well understood.
- Unwanted photo damage to cells should also be considered. Choose a laser with the appropriate wavelength to avoid regions of unwanted photon absorption. Also, limit the exposure of the cells to normal unfiltered microscope illumination as much as possible, as this light may also affect cell physiology, especially if a standard IR filter is not used in conjunction with normal microscope illumination. As a rule of thumb, use the minimal amount of illumination light necessary to generate a useable image. Where possible, use sensitive digital and analog detectors so as to minimize the amount of illumination light on the cells.
- Microscope optics can be damaged if the laser beam is too intense. In order to prevent damage to the objective lens, do not adjust optical components (e.g., mirrors, beam splitters) while the objective is being exposed to the intense laser beam. The cement used to hold the small optical lenses in the objective absorbs laser light, creating thermal and/or stress wave damage to the lenses.
- Laser exposure may produce eye injury and/or physical burns. Never view a laser beam directly or by specular reflection. Use laser safety glasses whenever possible. Be sure that the laser microscope has appropriate filtration or beam blocks so that the laser beam does not directly go through the oculars into the eyes. Where possible, enclose external beam paths and/or surround the optical table with appropriate laser safety curtains. There have been reported and unreported cases of retinal burns due to laser exposure. These have occurred when either aligning optics on the table surface or not blocking laser light from coming through the microscope ocular.
References
Ashkin, A., and Dziedzic, J. M. (1987). Optical trapping and manipulation of viruses and bacteria. Science 23/5, 1517-1519.
Berns, M. W. (1978). The laser microbeam as a probe for chromatin structure and function. Methods Cell Biol. 18, 277-294.
Berns, M. W., Aist, J. R., Wright, W. H., and Liang, H. (1992). Optical trapping in animal and plant cells using a tunable near-infrared titanium-sapphire laser. Exp. Cell Res. 198, 375-378.
Berns, M. W., Chong, L. K., Hammer-Wilson, M., Miller, K., and Siemens, A. (1979). Genetic microsurgery by laser: Establishment of a clonal population of rat kangaroo cells (PTK2) with a directed deficiency in a chromosomal nucleolar organizer. Chromosoma 73, 1-8.
Berns, M. W., Olson, R. S., and Rounds, D. E. (1969). In vitro production of chromosomal lesion using an argon laser microbeam. Nature 221, 74-75.
Berns, M. W, Tadir, Y., Liang, H., and Tromberg, B. (1998). Laser scissors and tweezers. Methods Cell Biol. 55, 71-98.
Berns, M. W., Wang, Z., Dunn, A., Wallace, V., and Venugopalan, V. (2000). Gene inactivation by multiphoton targeted photochemistry. Proc. Natl. Acad. Sci. USA 17, 9504-9507.
Berns, M. W., Wright, W. H., Tromberg, B. J., Profeta, G. A., Andrews, J. J., and Walter, R. J. (1989). Use of a laser-induced optical force trap to study chromosome movement on the mitotic spindle. Proc. Natl. Acad. Sci. USA 86, 4539-4543.
Berns, M. W., Wright, W. H., and Wiegand-Steubing, R. (1991). Laser microbeam as a tool in cell biology. Int. Rev. Cytol. 129, 1-44.
He, W. Y., Liu, Y., Smith, M., and Berns, M. W. (1997). Laser microdissection for generation of a human chromosome region specific library. Microsc. Microanal. 3, 47-52.
Khojakov, A., Cole, R. W., and Rieder, C. L. (1997). A synergy of technologies: Combining laser microsurgery with green fluorescent protein tagging. Cell Motil. Cytoskel. 38(4), 311-317.
Liang, H., and Berns, M. W. (1983). Establishment of nucleolar deficient sublines of PTK2 (Potorous tridactylis) by ultraviolet laser microirradiation. Exp. Cell Res. 144, 234-240.
Liang, H., Vu, K. T., Krishnan, P., Trang, T.C., Shin, D., Kimel, S., and Berns, M. W. (1996). Wavelength dependence of cell cloning efficiency after optical trapping. Biophys. J. 70, 1529-1533.
Liang, H., Wright, W. H., Cheng, S., He, W., and Berns, M. W. (1993). Micromanipulation of chromosomes in PTK2 cells using laser microsurgery (optical scalpel) in combination with laser induced optical force (optical tweezers). Exp. Cell Res. 204, 110-120.
Liang, H., Wright, W. H., He, W., and Berns, M. W. (1991). Micromanipulation of mitotic chromosomes in PTK2 cells using laser induced optical forces ("optical tweezers"). Exp. Cell Res. 197, 21-35.
Liang, H., Wright, W. H., Rieder, C. L., Salmon, E. D., Profeta, G., Andrews, J., Liu, Y., Sonek, G. J., and Berns, M. W. (1994). Directed movement of chromosome arms and fragments in mitotic newt lung cells using optical scissors and tweezers. Exp. Cell Res. 213, 308-312.
Liaw, L.-H. L., and Berns, M. W. (1981). Electron microscope autoradiography of serial sections of pre-selected single living cells. J. Ultrastruct. Res. 75, 187-194.
Rattner, J. B., and Berns, M. W. (1974). Light and electron microscopy of laser microirradiated chromosomes.
J. Cell Biol. 62, 526-533.
Schutze, K., Becker, B., Bernsen, M., Bjoernsen, T., Brocksch, D., Bush, C., Clement-Sengewald, A., van Dijk, M. C. R. F., Friedman, G., Heckl, W., Lahr, G., Lindhal, P., Mayer, A., Nilsson, S., Scheidl, S. J., Stich, M., Stolz, W., Takemoto, M., Thalhammer, S., Vogt, T., and Burgemeister, R. (2002). Tissue microdissection. In (D. Bowtell and D. Sambrook, eds.) "DNA Microarrays." Cold Spring Harbor Laboratory Press, Cold Spring Harbor, NY.
Tilapur, U. K., and Konig, K. (2002). Targeted transfection by femtosecond laser. Nature (Lond.) 418(6895), 290-291.
Vogel, A., and Venugopalan, V. (2003). Mechanisms of pulsed laser ablation of biological tissues. Chem Rev. 103(2), 577-644.
Vorobjev, I. A., Liang, H., Wright, W. H., and Berns, M. W. (1993). Optical trapping for chromosome manipulation: A wavelength dependence of induced chromosome bridges. Biophys. J. 64, 533-538.
Weber, G., and Greulich K. O. (1992). Manipulation of cells, organelles, and genomes by laser microbeam and optical trap. Int. Rev. Cytol. 133, 1-41.
Wiegand-Steubing, R. A., Cheng, W. H., Wright, W. H., Numajiri, Y., and Berns, M. W. (1991). Laser induced cell fusion in combination with optical tweezers: The laser cell fusion trap. Cytometry 12, 505-510.
Support our developers


