Single Molecule Imaging in Living Cells by Total Internal Reflection Fluorescence Microscopy
I. INTRODUCTIONTraditional approaches to molecular and cell biology rely on techniques that infer the behavior of biomolecules based on the properties of a large ensemble. While using such methods to derive the average behavior of a system clearly has been valuable in developing our understanding of biology, bulk measurements often fail to provide information on heterogeneity within the population. The development of methods to measure the electrical activity of single ion channels (Neher et al., 1978) first illustrated this point quite clearly, and the ensuing years have seen an explosion of interest in expanding our ability to study biological materials on a single molecule level, especially using optical techniques. Early studies in the field focused primarily on in vitro systems containing a limited number of purified components (Funatsu et al., 1995; Dickson et al., 1997; Pierce et al., 1997) and greatly advanced our ability to detect variations not only within a population of molecules, but within the behavior of individual molecules over time. More recently, several groups have demonstrated the possibility of adapting single molecule techniques to living cells (Sako et al., 2000; Ueda et al., 2001).
These new abilities have been facilitated by several factors, including (1) the advent of green fluorescent protein (GFP) as a fluorescent tag for proteins in their natural environment, (2) the improved sensitivity of intensified charge-coupled devices (ICCDs) and other detectors, and (3) the development and refinement of total internal reflection fluorescence (TIRF) microscopy (Axelrod, 2003). While other techniques, such as nearfield scanning optical microscopy (NSOM) and more traditional wide-field approaches, have been used for single molecule imaging in cells (Schutz et al., 1997; de Lange et al., 2001), TIRF is by far the most commonly used. In TIRF illumination, the excitation light is directed at the sample at a sufficiently large angle that it is totally internally reflected when it strikes the interface between the aqueous buffer and the glass substrate upon which it lies. This creates an exponentially decaying evanescent wave that penetrates into the sample to a depth of only 100-200nm, the exact distance depending on the refractive indices of the two materials. As a result, only fluorophores lying near the interface are excited efficiently. This greatly decreases the background signal contributed by out-of-focus fluorescence and helps increase the signal-to-noise ratio in the output image to the level required for single molecule detection. Ready-built TIRF systems are available from several microscope vendors (Olympus, Nikon); however, it is relatively simple to add TIRF optics to an ordinary, inverted microscope, which is often preferable to commercial options due to the greater flexibility such an approach provides for later modifications to the system. This chapter provides an overview of how to construct, align, and use a TIRF system for single molecule imaging in live cells.
II. MATERIALS AND INSTRUMENTATION
Several commercial sources exist for optical devices and accessories. Some that are used commonly in our laboratory include the following.
Newport Scientific: Vibration isolation tables, optical mounts, lenses (www.newport.com)
Chroma: Excitation and emission filters (www.chroma. com)
New Focus: Optics and optical mounts (www.newfocus.com)
Stanford Photonics: ICCD cameras (www.solameretech.com)
Oriel: Optical fibers and accessories (www.oriel.com)
Melles Griot: Argon-ion and HeNe lasers (www.mellesgriot.com)
MatTek: Glass-bottom cell culture dishes (www. mattek.com)
Bioptechs: Temperature control and perfusion equipment (www.bioptechs.com)
Optical Insights: Beam splitters for simultaneous, two-color imaging (www.optical-insights.com)
In addition, some manufacturers provide prebuilt TIRF systems:
Olympus: www.olympusamerica.com
Nikon: www.nikonusa.com
III. PROCEDURES
A. Illumination Strategies
TIRF can be achieved using one of a number of illumination schemes, but most researchers use either prism- or objective-type configurations. In prism-type TIRF, the excitation laser does not enter the internal optical path of the microscope, but rather is directed at the sample from above, through a prism that is optically coupled to the glass slide via a layer of glycerol. Total internal reflection occurs at the interface between the slide and the sample medium, and the excitation beam is completely reflected away from the sample volume. In order to be visible, samples must be firmly attached to the glass slide, which is then affixed with a coverslip and inverted. This results in the major limitation of prism-type illumination, which is that the sample becomes completely enclosed between the two glass surfaces. Since the plane of illumination lies a distance equal to the thickness of the coverslip plus that of the sample away from the objective, one must use a very small sample volume in order to obtain images with high numerical aperture (NA), short working distance objectives. These considerations make it a poor choice for live cell applications in which cell health might be compromised by extended isolation in a confined, oxygen-poor environment. It is primarily for this reason that we perform the majority of our live cell, single molecule imaging using an objective-type microscope.
In objective-type TIRF, the excitation beam enters the microscope through one of its illumination ports and is directed at the sample through the microscope objective, as in epifluorescence illumination. To achieve TIR, the beam is brought into focus at the back focal plane of the objective, but is aligned at the peripheral edge of the objective rather than at the center, as in epifluorescence microscopy. This offset changes the illumination angle as the beam approaches the sample. The maximum angle of illumination depends on the numerical aperture of the objective, and for 1.4 NA objectives is 67°. Since the critical angle for TIR at the cell-glass interface is roughly 65°, this makes it difficult to position the beam so that it will be totally internally reflected. Several microscope manufacturers have begun to produce larger NA objectives that increase the ease of aligning the beam in an objective-type system. In our microscope, we use a 1.45 NA objective (Zeiss), which has a maximum cone angle of approximately 71°. Olympus sells a 1.65 NA objective that offers great flexibility in aligning TIRF systems, but carries the liability of requiring specially designed coverslips and immersion oils of a high refractive index. The major disadvantage to using objective-type configurations is that they are more prone to background signals arising from the excitation beam, as it is reflected toward the detector, and can also generate spurious reflections or fluorescence within the objective itself. However, these tradeoffs are minor in comparison to the gain in cell health offered by objective-type illumination.
B. Choice of Detector
Due to their extreme sensitivity and high readout speed, intensified charge-coupled device-based cameras are excellent for single molecule imaging. High-end ICCDs have single photon sensitivity under ideal conditions and can acquire 640 x 480 images directly to digital storage media at rates of over 100 frames per second. At these speeds, the rate of photon emission by a single fluorophore becomes a limiting factor in obtaining a reasonable signal-to-noise ratio. There are, however, several disadvantages to ICCDs. The intensification process can result in noise due to ion feedback events and dark current in the intensifier, as well as the emergence of low-intensity "valleys" at boundary points in the image, such as those surrounding single fluorophores. The intensifier also introduces nonlinearity in the response of the detector to light, and so care must be taken to ensure that one is working within the linear range of the camera if quantitative measurements of fluorescence intensity are to be made. Advances in camera technology are changing these limitations, however. For instance, Stanford Photonics now produces a dual-intensifier camera that is cooled by a water jacket, which shows great promise for single molecule imaging due to its extremely low noise levels.
Traditional, cooled CCDs are a feasible alternative in some applications and are desirable for their high image quality and the strong linearity of their response. Unfortunately, they also have slow readout speeds, a problem that some researchers have overcome by reading from only a small region of the detector. This is of course not an option if one wishes to image a relatively large area such as an entire cell surface, and even under ideal conditions the temporal resolution provided by cooled CCDs might not be great enough to observe more rapid phenomena, such as the lateral diffusion of certain membrane proteins or lipids. Still, cooled CCDs have been extremely useful in some cases. For example, Yildiz et al. (2003) used this approach to track single myosin motors walking along actin filaments to a precision of 1.5 nm.
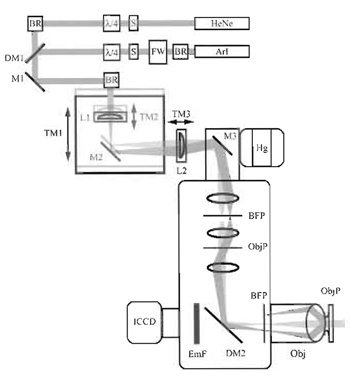 |
| FIGURE 1 Optical configuration of the objective-type TIRF microscope used in our laboratory. The excitation light paths are indicated for both lasers in one of two configurations. In one (light gray), beams are aligned with the optical axis of the excitation port of the microscope and travel up the center of the objective, generating transmitted fluorescence illumination of the sample. In the second, beams enter the illumination port off axis, traveling up the edge of the objective, and are totally internally reflected at the sample. Switching between the two types of illumination can be accomplished by moving the translation mount TM1. Beam size, and thus the size of the TIRF illumination spot, is determined by the relative positions of lenses L1 and L2. HeNe, helium-neon laser; ArI, mixed wavelength argon-ion laser; S, shutter; BR, beam riser; FW, filter wheel; λ4, quarter-wave plate; DM1-2, dichroic mirrors; M1-3, mirrors; L1-3, lenses; TM1-3, translation mounts; Hg, mercury arc lamp; BFP, back focal plane of the objective; ObjP, object plane; Obj, objective; EmF, emission filter; ICCD, intensified chargecoupled device-based camera. |
C. Microscope Layout
The configuration of our objective-type TIRF microscope is shown in Fig. 1. In this geometry, excitation light from the HeNe and argon-ion lasers is combined at the first dichroic mirror and is coaligned through the remaining optical elements. The filter wheel placed outside the argon laser allows rapid selection of the excitation wavelength from the multiwavelength source. To avoid selective excitation of fluorophores with a given orientation, the illumination light is depolarized by a quarter-wave plate placed in each beam path. Lateral positioning of the excitation beams within the objective is controlled through the movements of TM1, which regulates the incidence angle at the sample. Rotation of mirror M3 180° allows the user to switch between TIRF and epifluorescence illumination. Optics shown inside the microscope housing are all fixed components, supplied by the manufacturer.
D. Laser Alignment
- Bring the two beams (Argon and HeNe) into alignment with one another. Irises fixed at the desired height and placed at various points in the optical path can be enormously useful in this step. Using the beam riser mirrors, align both beams to the horizontal axis at the same height, as measured at at least two points before DM1 along each path. Ensure that the beam spots at DM1 and M1 overlap completely with one another. In all alignment steps, make efforts to align the beams as close to the center of each optical element as possible.
- Center the combined beams at L1, M2, L2, and M3.
- Remove L1, L2, and the objective from their positions and center the beam in the microscope cavity by watching the projected illumination spot above the microscope housing. A piece of white paper placed above the microscope can be useful in this step. To achieve the best possible alignment, make sure that the beam profile is not clipped when the microscope's field and aperture diaphragms are closed.
- Replace L2 and adjust its position to minimize the size of the projected beam spot.
- Replace L1 and the objective, and mount a fluorescently labeled sample (preferably cells or fluorescent beads). Bring the ventral surface of the sample into focus as viewed through the eyepieces. (See Section IVD).
- Remove the sample and clean the immersion oil from the objective. Adjust L1 to minimize the size of the projected beam spot. Ensure that the beam is collimated as it emerges from the objective.
- Apply immersion oil to the objective and place a glass coverslip on top of it. Optically couple a pianoconvex lens to the coverslip with more immersion oil. This will frustrate total internal reflection at the glass-air interface and allow one to follow the projected beam position over a wide range of incidence angles. Move TM1 to deflect the beam until it begins to be clipped by the back focal plane of the objective. This indicates that the largest possible incidence angle has been reached. Readjust TM1 to barely eliminate clipping and remove the coverslip and lens.
- Place a fluorescent sample (in our experience, either 200-nm fluorescent beads or an aqueous solution of a fluorophore at high concentration are best) on the microscope and observe through the eyepieces to ensure that TIRF has been attained. The success of the alignment can be assessed by the presence of a very shallow focal plane and low fluorescent background from nonsurface-adsorbed fluorophores. It might be necessary at this point to center the illumination spot by moving M1 or M2.
E. Imaging Single GFPs
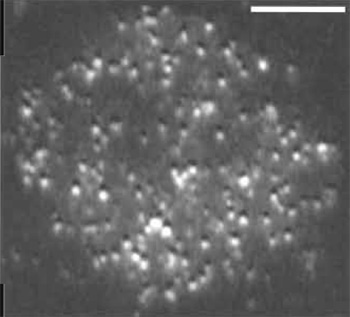 |
| FIGURE 2 Single molecules of Lck-GFP in a T-cell membrane. Objective-type TIRF was used to image Jurkat T cells that were stably transfected with a GFP fusion of the membrane-associated, tyrosine kinase, Lck, and selected for low expression levels. Scale bar: 10µm. The bright punctae in the image correspond to single molecules. This image was taken from a single frame of a sequence acquired at video rate (30 fps). |
The greatest difficulty with imaging single fluorescent proteins lies in titrating their expression. At high levels of GFP expression, the density of tagged protein can result in multiple fluorophores being closer to one another than the diffraction limit of light, which prevents the identification of single molecules. Because most vectors are designed to drive high levels of protein expression, obtaining a suitable density of GFP can be difficult. As a long-term solution, it is desirable to create a cell line that stably expresses very low levels of GFP (Fig. 2). This is usually possible, but requires the labor-intensive screening of clonally derived cell lines (most of which will express too much of the transgene) by TIRE Alternatively, cells can be imaged either very early (several hours) or very late (over a week) after transfection, which will enrich the number of low-expressing cells, although cells will be extremely variable in their fluorescence levels. Another approach is to sort the transfectants by FACS and collect only the lowest expression group for imaging. It is also possible to place the transgene under the control of an inducible promoter element and titrate the level of inducer to optimize expression levels. In many cases, basal levels of expression from the uninduced promoter suffice for single molecule imaging. We have found this to be true for uninduced metallothionine promoters in a Drosophila cell culture system.
As the first single molecule studies of GFP demonstrated (Dickson et al., 1997; Pierce et al., 1997), emission from fluorescent proteins is often unstable, a property that is not usually shared by their small organic counterparts. This can result in the molecule disappearing for short intervals, thereby complicating single molecule tracking. In most situations, however, the dark states of GFP are short-lived, typically lasting only a frame or two at video rate, and are infrequent enough that they do not pose an insurmountable problem to obtaining useful data.
F.Sample Preparation
There are several options for systems in which to mount cells for single molecule imaging. A luxury afforded by objective-type TIRF is the ability to use glass-bottom tissue culture dishes, which allow one to grow cells on a surface that is suitable for microscopy. Alternatively, cells can be adhered to glass coverslips and imaged in a perfusion chamber, such as the closed configuration system available from Bioptechs. When used in conjunction with objective and sample heating elements, the latter solution allows for the greatest degree of control over environmental parameters that affect cell health and makes it possible to change buffer conditions rapidly (e.g., by perfusing pharmacological agents, antibodies, or chemoattractants). Heating the sample with an external heat source (such as a hot air blower pointed at the stage assembly) is possible, but resulting oscillations in stage position can make in quite difficult to maintain the tight control over the focal plane that is needed for single particle tracking.
In all cases, it is advisable to clean the glass substrate before use in order to remove fluorescent impurities that would complicate imaging and to impart an electrical charge to the glass to facilitate cell adhesion or surface functionalization. This can be accomplished in a number of ways. We immerse the glass overnight in an aqueous solution of 70% sulfuric acid and 9% hydrogen peroxide. The mixture will evolve a good deal of heat when prepared and should be applied to the glass while still hot. This combination of reagents is predictably quite volatile and should only be used in a fume hood by persons wearing appropriate protective attire.
It is often useful to coat the glass with various substances prior to use. Such treatments do not appear to adversely affect the quality of single molecule images obtained by TIRF. In our experiments, we have successfully imaged various cell types adhering to a variety of materials on the coverslip surface, including antibodies, concanavalin A, and polylysine. Good cell adhesion is a prerequisite for TIRF, as the cell membrane must lie within the evanescent wave to be visible. However, in our experience with many cell types, polylysine coating is not necessary for adhesion if the glass has been cleaned thoroughly first.
Finally, the choice of imaging buffer can be tremendously important for obtaining high-quality, single molecule images. Buffers should be free of substances with appreciable fluorescence in the desired wavelength range, which eliminates the use of most tissue culture media (especially those containing serum or colorimetric pH indicators) during the imaging process. For the majority of our experiments, we have used a modified HEPES-buffered saline solution (20mM HEPES, 135mM NaCl, 4mM KCl, 1 mM Na2HPO4, 10mM glucose, 1mM CaCl2, 0.5 mM MgCl2, pH 7.4). All cell types should be washed with imaging buffer one or two times before beginning the experiment. Adherent cultures should be washed especially thoroughly if they have been grown on the imaging surface, as they tend to produce debris that can complicate single molecule imaging.
G. Simultaneous Imaging of Multiple Fluorophores
The discovery and development of fluorescent proteins with a wide variety of excitation and emission properties have provided researchers with the ability to simultaneously observe the behavior of two or more types of protein in living cells. The combination of GFP and DsRed is of particular interest for single molecule imaging. Both proteins can be excited by the 488-nm line of an argon-ion laser quite efficiently, and yet emit light of widely disparate wavelengths that can be separated using conventional dichroic mirrors and filtersets. For real time, simultaneous imaging of both proteins at video rate, a beam splitter module is available from Optical Insights that projects the two emission wavelengths onto different halves of the detector, eliminating the need for multiple cameras and emission paths. This allows one to acquire both color components of the image without switching excitation sources, which is often essential due to the rapid timescale on which changes can occur at the single molecule level (Campbell et al., 2002). For dual-color imaging with GFP, the most suitable version of DsRed is a dimeric variant, termed the "tandem dimer," in which two identical copies of the modified DsRed transcript are connected to one another by a short linker region. The high effective concentration of the linked fluorophores in the translated protein is thought to favor the formation of intra- rather than intermolecular contacts and prevents aggregation effects from interfering with the function of the protein to which the tag is attached. The tandem dimer is preferable to the monomeric version of the protein in that it retains the ability to be excited at 488 nm, while the monomer does not. We have imaged single molecules of GFP and the tandem dimer in the same sample using 488-nm excitation and have found the two fluorophores to be quite spectrally separable from one another. It remains to be seen how generally valuable DsRed will be for live cell, single molecule imaging, as it is significantly dimmer than GFP at 488-nm excitation and might not provide a high enough signal for the detection of rapidly moving proteins. At the very least, the tandem dimer should provide a useful counterstain to mark one component at the population level while imaging single molecules of a GFP-tagged protein.
Dual-color imaging of small organic fluorophores is also possible, but the majority of such combinations require the simultaneous use of two excitation sources. This is made relatively easy by excitation filter sets that are designed to deal with two wavelengths, but it demands that careful attention be paid to the coalignment of the two sources with one another. We, for example, have obtained dual-color images of Cy3- and Cy5-1abeled proteins diffusing in artificial lipid bilayers and interacting with Jurkat T cells. Experiments done in vitro have also shown this fluorophore combination to be useful for single molecule FRET, a technique that several groups have applied to living cells (Sako et al., 2000). Finally, although it is a nascent technology, the application of semiconductor quantum dots as single molecule tags (Dahan et al., 2003) promises to simplify illumination schemes greatly for multicolor, single molecule experiments.
H. Image Analysis
The precise method of analysis to choose will of course depend on the information that is desired, but there are a few analytical issues that apply to most single molecule experiments. Most prominent among these is the systematic, automated identification of single fluorophores. The relatively low signal-to-noise level achieved in single molecule images poses a problem in this regard, as it is sometimes impossible to distinguish between a fluorophore and a region of high background fluorescence based solely on a static intensity threshold. Furthermore, if the molecules of interest are moving rapidly in the X-Y plane, as they often are in studies of membrane proteins, it can be quite difficult to follow single molecules through consecutive frames. Several groups have developed tracking algorithms to overcome these problems, and most of these utilize some measure of the molecule's shape or X-Y intensity distribution to identify relevant spots in an image (Gelles et al., 1988; Cheezum et al., 2001). In our laboratory, we have developed a tracking routine that uses cross-correlation between an idealized molecule and the TIRF image to find spots (Klopfenstein et al., 2002). Continuity of molecular trajectories between frames is obtained by ensuring that the fluorophores are at a very low density in the cell surface (to prevent confusion between neighboring molecules) and by including a search radius as a tracking parameter. The latter point restricts the search to a small area around the initial location of the molecule, under the assumption that it is moving with a fairly predictable speed. We have implemented this routine using the commercially available MATLAB software, but similar procedures could easily be developed in other programming environments.
While cross-correlation is a great improvement over manual tracking, it is computationally inefficient, requiring a relatively large amount of CPU time to track a single spot. This makes it impractical for the automated detection and tracking of every molecule in an image, and in our analyses we manually indicate which spot to follow by providing its initial Cartesian coordinates to the tracking algorithm. Complete automation of the procedure for all spots in an image sequence might be achievable by more efficient algorithms, such as fitting to a theoretical function (e.g., a Gaussian distribution), line-based routines, or segmentation analysis. We have applied a set of particle tracking routines maintained by Dr. Eric Weeks (available at www.physics.emory.edu/~weeks/idl) to this task, with extremely promising results.
Positional information is not the only parameter that can be obtained from single molecule images. The quantized nature of single molecule fluorescence makes the technique suitable for obtaining estimates of oligomerization state based on spot intensity and has been used to this end in studies of GFP-tagged E-cadherin in living fibroblasts (Iino et al., 2001). The addition of polarization optics to a TIRF microscope enables measurements of molecular orientation at the single molecule level and can provide striking information about dynamic changes in parameters such as protein conformation and binding events (Khan et al., 2000). Single molecule FRET is also just beginning to be explored and holds great promise for measuring protein-protein interactions in living cells.
IV. PITFALLS
A. Visualization of Internal Structures
While the evanescent wave created in TIRF microscopy penetrates to a shallow depth, it is still possible to visualize structures that are inside the cell, rather than at its surface. Several studies have exploited this to monitor the dynamics of vesicle fusion with the plasma membrane (Toomre et al., 2000), but it can be a source of complication in single molecule experiments. This is particularly problematic with proteins that partition into both plasma membrane and vesicular pools and can lead to spurious conclusions about protein behavior. Due to the low intensity of the excitation light at the cell interior, however, it is very unlikely that single molecules on vesicle surfaces will be visible. It is more probable that signals from the cell interior will represent clusters of several fluorophores, although internal structures might show fluorescence intensities similar to those of single molecules. To avoid confusion between surface and internal components then it is important to only analyze spots that can be attributed to single molecules, i.e., that photobleach in a single step. Alternatives might include performing TIRF with a system in which the illumination depth is reduced-for instance, by the use of substrates with higher refractive indices or by the imposition of an intermediate layer, acting as a spacer, between the glass and the sample. However, these require a significant investment of time and effort to implement.
B. Objective Fluorescence
Materials used in construction of the high NA objectives used in objective-type TIRF fluoresce at certain excitation wavelengths, an effect that was ignored in their development because the fluorescence is small compared to the signal generated by traditional epifluorescence and confocal microscopies. Unfortunately, this background fluorescence is detectable in systems with single molecule sensitivity, and while it does not prevent the detection of single molecules, it does reduce the signal-to-noise ratio. We have noticed this effect with a number of different objectives from several manufacturers. There is at present no solution to this problem, but in our hands the effect is only noticeable when simultaneously imaging dyes with wavelengths similar to Cy3 and Cy5. Excitation with the 514-nm line used for Cy3 causes the objective to fluoresce in the far red end of the spectrum, where Cy5 emits, and this contributes to the background in the Cy5 channel.
C. Inhomogeneous Illumination
A problem with coherent light such as that emitted by lasers is its tendency to generate interference patterns. The problem is compounded by imperfections in the optical elements used to route the laser to its destination, and in TIRF systems this can result in local intensity minima and maxima within the illumination spot. A number of methods can be employed to homogenize the spot profile. Holographic beam diffusers and ground glass elements accomplish this quite completely, but the resulting beam divergence is typically too severe to allow proper TIR alignment, even when a downbeam lens is used to attempt to regain collimation. A more suitable approach is to route the excitation light through a multimode optical fiber that has been bent at a narrow angle. Alignment of the beam into and out of the fiber can be laborious, but once achieved it results in a homogeneous and well-collimated beam.
D. Changes in Incidence Angle while Focusing
If the microscope utilizes a translatable objective mount to adjust the image focus, another problem will arise when implementing TIRF. As the objective is moved vertically, the position of its back focal plane will change, resulting in a loss of collimation in the beam as it passes through the objective. This is not normally a problem if the beam has been aligned such that it propagates into the edge of the objective lens, as the incidence angle will already be well beyond the critical angle required for total internal reflection, and changes in collimation will be small. It must be emphasized, however, that the objective should be as close to its in-focus location as possible before aligning the laser to achieve TIRE Otherwise, subsequent focusing on the bottom surface of the sample can greatly disrupt the incidence angle of the laser, leading to transmission of a substantial portion of the light through the objective and into the cell. The ideal method of avoiding this is to control image focus by moving the microscope stage, rather than the objective, but it is not completely necessary.
Acknowledgments
The authors thank Nico Stuurman and Reed Kelso for valuable discussions relevant to the manuscript.
References
Axelrod, D. (2003). Total internal reflection fluorescence microscopy in cell biology. Methods Enzymol 361, 1-33.
Campbell, R. E., Tour, O., Palmer, A. E., Steinbach, P. A., Baird, G. S., Zacharias, D. A., and Tsien, R. Y. (2002). A monomeric red fluorescent protein. Proc. Natl. Acad. Sci. USA 99(12), 7877-7882.
Cheezum, M. K., Walker, W. F., and Guilford, W. H. (2001). Quantitative comparison of algorithms for tracking single fluorescent particles. Biophys J. 81(4), 2378-2388.
Dahan, M., Levi, S., Luccardini, C., Rostaing, P., Riveau, B., and Triller, A. (2003). Diffusion dynamics of glycine receptors revealed by single-quantum dot tracking. Science 302(5644), 442-445.
de Lange, F., Cambi, A., Huijbens, R., de Bakker, B., Rensen, W., Garcia-Parajo, M., van Hulst, N., and Figdor, C. G. (2001). Cell biology beyond the diffraction limit: Near-field scanning optical microscopy. J. Cell. Sci. 114(Pt. 23), 4153-4160.
Dickson, R. M., Cubitt, A. B., Tsien, R. Y., and Moerner, W. E. (1997). On/off blinking and switching behaviour of single molecules of green fluorescent protein. Nature 388(6640), 355-358.
Funatsu, T., Harada, Y., Tokunaga, M., Saito, K., and Yanagida, T. (1995). Imaging of single fluorescent molecules and individual ATP turnovers by single myosin molecules in aqueous solution. Nature 374(6522), 555-559.
Gelles, J., Schnapp, B. J., and Sheetz, M. P. (1988). Tracking kinesindriven movements with nanometre-scale precision. Nature 331(6155), 450-453.
Iino, R., Koyama, I., and Kusumi, A. (2001). Single molecule imaging of green fluorescent proteins in living cells: E-cadherin forms oligomers on the free cell surface. Biophys J. 80(6), 2667-2677.
Khan, S., Pierce, D., and Vale, R. D. (2000). Interactions of the chemotaxis signal protein CheY with bacterial flagellar motors visualized by evanescent wave microscopy. Curr. Biol. 10(15), 927-930.
Klopfenstein, D. R., Tomishige, M., Stuurman, N., and Vale, R. D. (2002). Role of phosphatidylinositol(4,5)bisphosphate organization in membrane transport by the Uncl04 kinesin motor. Cell 109(3), 347-358.
Neher, E., Sakmann, B., and Steinbach, J. H. (1978). The extracellular patch clamp: A method for resolving currents through individual open channels in biological membranes. Pflug. Arch. 375(2), 219-228.
Pierce, D. W., Hom-Booher, N., and Vale, R. D. (1997). Imaging individual green fluorescent proteins. Nature 388(6640), 338.
Sako, Y., Minoghchi, S., and Yanagida, T. (2000). Single-molecule imaging of EGFR signalling on the surface of living cells. Nature Cell Biol. 2(3), 168-172.
Schutz, G. J., Schindler, H., and Schmidt, T. (1997). Single-molecule microscopy on model membranes reveals anomalous diffusion. Biophys J. 73(2), 1073-1080.
Toomre, D., Steyer, J. A., Keller, P., Almers, W., and Simons, K. (2000). Fusion of constitutive membrane traffic with the cell surface observed by evanescent wave microscopy. J. Cell Biol. 149(1), 33-40.
Ueda, M., Sako, Y., Tanaka, T., Devreotes, P., and Yanagida, T. (2001). Single-molecule analysis of chemotactic signaling in Dictyostelium cells. Science 294(5543), 864-867.
Yildiz, A., Forkey, J. N., McKinney, S. A., Ha, T., Goldman, Y. E., and Selvin, P. R. (2003). Myosin V walks hand-over-hand: single fluorophore imaging with 1.5-nm localization. Science 300(5628), 2061-2065.
Support our developers


