Recombination frequencies from a test-cross
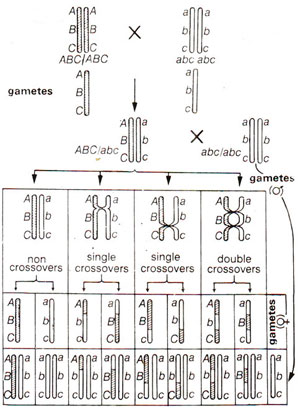
Fig. 10.8. A three-point testcross involving three hypothetical genes A, B and C.
Recombination frequencies from a test-cross
(A three-point testcross)
Since recombination frequencies are directly proportional to distances between genes in question, these values can be used in preparation of linkage maps. A three-point testcross (involving three genes) to be discussed in this section not only gives us information regarding relative distances between these genes, but also tells us the linear order in which these genes should be present on the chromosome. The underlying basic principle involved in preparation of linkage maps can be explained by using a hypothetical example.
Let us presume that there are three genes A, B and C present on the same chromdsome (i.e. these are linked). There could be three possible linear orders in which these genes may be present on a chromosome. These are A-B-C, A-C-B or B-A-C. As is obvious, that in one case B is present in the middle, while in the other two cases C and A respectively are present at the middle position. Therefore, in finding out the linear order, one has to really find out the gene which is present in the centre. For this purpose a three point test-cross is made, which involves crossing of a trihybrid ABC/abc (obtained from a cross ABC/ABC x abc/abc) with triple homozygous recessive abc/abc. The progeny obtained will represent the gametes formed by the hybrid. Presuming A-B-C as the order of genes, results expected can be diagrammatically represented as in Figure 10.8.
Fig. 10.8. A three-point testcross involving three hypothetical genes A, B and C.
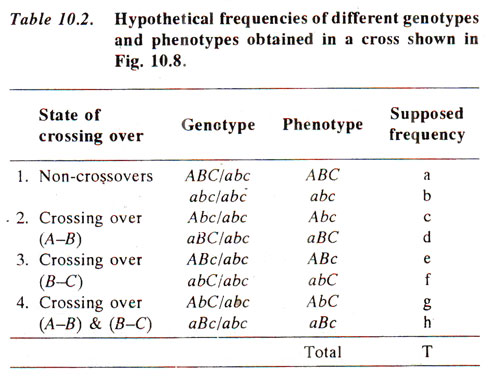
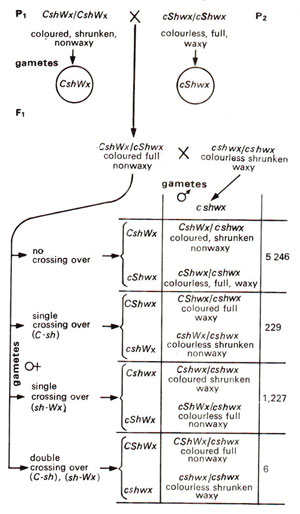
Fig. 10.9. A three-point testcross in maize involving three genes, coloured (C) vs colourless (c), full (Sh) vs shrunken (sh) and non-waxy (Wx) vs waxy (wx).
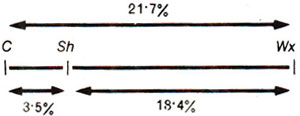
Fig. 10.10. A linkage map prepared from results presented in Figure 10.9.
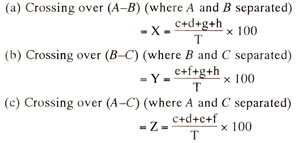
From the above values of X, Y and Z, order of genes can be worked out and the linkage map can be prepared using the following criteria : if Z = X + Y, order of genes is A-B-C; if Z = X - Y, order of genes is A-C-B, if Z = Y - X, order of genes is B-A-C.
Preparation of a linkage map can be further illustrated by using an example from maize involving three endosperm characters. These three characters are coloured aleurone (C) versus colourless aleurone (c), full endosperm (Sh) versus shrunken endosperm (sh) and non-waxy endosperm (Wx) versus waxy endosperm (ws). The data reported by C.B. Hutchinson in 1922 in a three-point testcross are presented in Figure 10.9. As shown in previous hypothetical example, three recombination values i.e. C-Sh, Sh-Wx and C-Wx would be worked out in order to find out the linear order of the three genes C, Sh and Wx.
Fig. 10.9. A three-point testcross in maize involving three genes, coloured (C) vs colourless (c), full (Sh) vs shrunken (sh) and non-waxy (Wx) vs waxy (wx).
In data presented in Figure 10.9, C and sh are present together in P1 Therefore, the progeny showing their separation would be recorded as recombination between C and Sh.
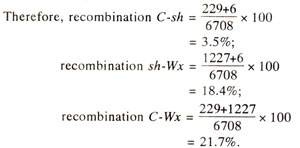
Fig. 10.10. A linkage map prepared from results presented in Figure 10.9.
Support our developers


