In the above discussion, we noticed that the map distance (or 'true distance') between two loci on a linkage map is not linearly related to recombination frequency (RF), when the latter (i.e. RF) increases beyond a certain level. This is due to the presence of double crossovers and multiple crossovers. In view of this, the recombination frequencies need a mathematical treatment to get relatively precise estimates of map distances between loci. This is achieved through the use of a
mapping function. A relationship between two variables, which enables estimation of the value of one from the value of the other is called a
function. With this definition of function (as used in mathematics), the relationship between real map distance and recombination frequency is called the mapping function. The occurrence of crossovers along a chromosome during meiosis, that is responsible for recombination, can be described by the
Poisson Distribution, which is used for events having a low mean value (as opposed to
Normal and
Binomial Distributions, where the mean value of an event is relatively high; consult a Statistics book and
Quantitative Inheritance).
For crossovers or recombination frequencies, Poisson distribution is employed, because over a small region of a chromosome, crossing over will take place in a small number of cells out of a total number of cells undergoing meiosis. In this small region of chromosome, if we know the mean number of crossovers, we can calculate the distribution (or probability of occurrence) of 0, 1, 2, 3, 4 or more crossovers in this region, using the Poisson distribution described as follows.
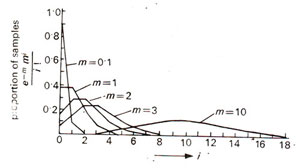
Fig. 10.13. Poisson distribution for five different values of mean (m = mean ; i = actual number of events). (Redrawn from Sokal and Rohlf, 1973).
If
'm' represents the mean number of events, and '
i' represents the number of events in a particular class (e.g. zero or 1 or 2 crossovers in the region), then the frequency of the class with
i events, i.e.
f(i) or the frequency of theclass will be calculated by the general expression of Poisson distribution, which is as follows :

In this expression
e = base of natural logarithms
(e = 2.7 approximately) and ! is the factorial symbol (e.g.
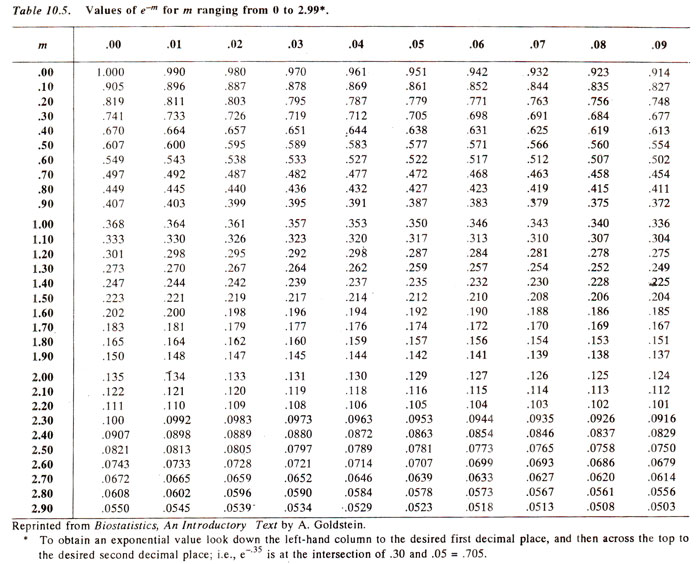
i ! = 3 ! = 3 x 2 x 1 = 6; by definition 0 ! = 1). Using this expression if
m is known,
e-m can be obtained from the Table 10.5, and
mi and
i ! can be worked out (since
i is known), to get the values of
f(
i), where
i = 0, 1,
2,...,n. For different values of
m, Poisson distributions are given in Figure 10.13.
Fig. 10.13. Poisson distribution for five different values of mean (m = mean ; i = actual number of events). (Redrawn from Sokal and Rohlf, 1973).
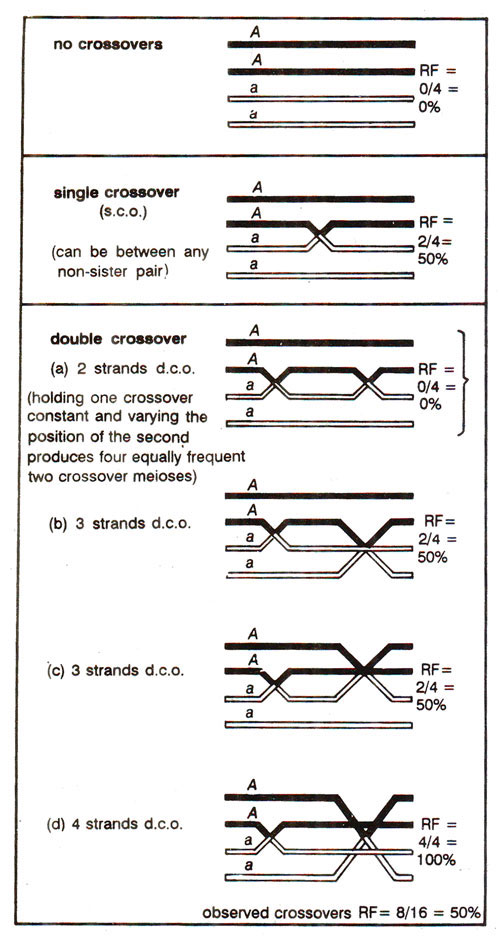
Fig. 10.14. Demonstration that the overall RF is 50 per cent for meioses, in which non-zero crossovers occur (recombinant chromatids are shown by open double lines; parental chromatids by solid lines).
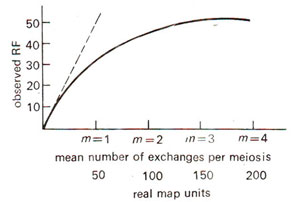
Fig. 10.15. The mapping function in graphic form (solid line); the dashed line represents the linear relationship found for small values of m.
It can be shown that during crossing over in a region, all cells with two crossovers will together produce 50% recombinants (like cells with single crossovers); similarly, cells with three crossovers or four crossovers or other classes each will produce 50% recombinants among their products. This simplifies the situation of Poisson distribution, since meiotic cells can be classified now in only two classes, those giving RF = 0 and those giving RF = 50%. The former will include non-crossovers and the latter will include cells with atleast one crossover (single, double, triple and multiple crossovers). This is illustrated in Figure 10.14.
Based on the above, we can derive the mapping function. The frequency of cells with
m = zero (mean frequency of cells with zero crossovers) will be calculated as follows :

If
f(0) = e
-m is subtracted from the total population, (i.e. 1.0) of cells, then 1 -
e-m will give cells with atleast one crossover. These cells will give products, 50% of which will be recombinants, so that RF = 1/2 (1 -
e-m). From this equation, if RF is known,
m can be calculated as follows using a calculator and log table :
RF = 1/2 (1 –
e-m)
or
e-m = 1 - 2 RF
or
-m = log
n (1-2 RF)
or
m = - log
n (1-2 RF) = mapping function
(where log
n = natural logarithm)
This value of
m will be an index of true map distance (m = 1 = 50 cM;
m = 2 = 100 cM;
m = 4 = 200 cM) or actual average number of crossovers in a region. In Figure 10.15, the value of
m derived through the use of mapping function has been plotted against RF values. If can be shown that for RF, values upto 10% (
m = 0.1 = 20 m.u), will be linear with map units expressed in cM. But for higher values, this relationship will not hold good (e.g. for RF = 27.5%,
m = 0.8 = 40 m.u = 40 cM), so that if RF values are used for mapping directly without employing mapping function, the distance will be underestimated.
Fig. 10.14. Demonstration that the overall RF is 50 per cent for meioses, in which non-zero crossovers occur (recombinant chromatids are shown by open double lines; parental chromatids by solid lines).
Fig. 10.15. The mapping function in graphic form (solid line); the dashed line represents the linear relationship found for small values of m.
In recent years, for the preparation of molecular maps, also described as RFLP maps, the above and/or similar other mapping functions have been employed to prepare computer programmes, which can be used to get the linkage maps directly from the recombination data. One such program commonly used for preparing these molecular maps is
MAPMAKER.