Quantitative Determinations of Algal Density and Growth
Although tedious, time-consuming, and requiring an excellence in taxonomic identifications, the traditional counting of phytoplankton is still unsurpassed for quantifying plankton, especially at low limits of detection. The examination and counting of preserved material also allows for direct observation and assessment of cell condition. The fundamental issue that must be addressed
prior to choosing a counting technique is whether samples must be concentrated. The three routine methods used to concentrate phytoplankton samples are centrifugation and filtration for live samples and sedimentation (gravitational settling) for preserved samples. Centrifugation and sedimentation are the most commonly used, although filtration onto membrane filters is an effective
procedure for fluorescence microscopic enumerations. If the cell density is less than 10
5 cells l
-1, the sample needs to be concentrated; if cell density is too high to allow direct counting, the sample will be diluted. Dilution or concentration factors need to be taken into account for calculating the final cell concentration.
Species containing gas vacuoles (cyanobacteria) are unlikely to fully sediment despite the Lugol’s fixation. Two methods are available for collapsing vacuoles to assist sedimentation. Samples can either be exposed to brief ultrasonification (<1 min, but may vary for different species) or alternatively, pressure can be applied to the sample by forcing it through a syringe with a fine needle; this will collapse the vacuoles and the cells will then settle through gravity.
If the water sample contains sufficient number of algae and concentration is not required, a direct count can be undertaken. The sample is thoroughly mixed, treated with a few drops of Lugol’s solution, mixed again and allowed to stand for 30–60 min. The sample is mixed again and the subsamples are used for direct counting and taxonomic identification.
When concentration is required, a simple procedure for gravitational settling is to pour a wellmixed volume of the sample of water containing the microalgae in a measuring cylinder (100 ml), add Lugol’s solution to it (1% by volume), and either allow the sample to stand overnight or use a centrifuge so that the cells sink. The iodine in Lugol’s solution not only preserves and stains the cells but also increases their density. When the column of water appears clear, the top 90 ml will be gently siphoned off without disturbing the sediment at the base of the cylinder. This leaves the cells concentrated in the bottom 10 ml. Subsamples of this sedimented fraction can be used for counting procedure and examined under the microscope for identification, keeping in
mind that the cells of the original sample have been concentrated 10 times.
At present, there are many kinds of counting procedures available for enumerating phytoplankton, depending on whether counting algae in mixtures, as from field sampling, or unialgal samples, such as in growth or bioassay experiments in a laboratory. Some techniques are relatively “low-tech,” and can be used also in remote locations, other are “high-tech,” and require an expensiveinstrument.

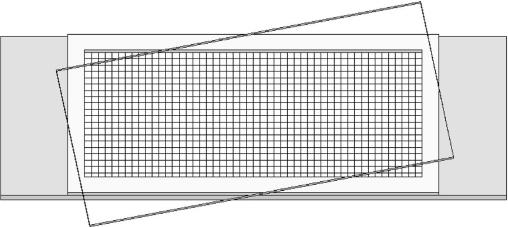
FIGURE 6.2 Schematic drawing of the Sedgewick-Rafter counting chamber.
The Sedgewick-Rafter counting chamber (Figure 6.2) is a low tech device routinely used for counting algae in mixed assemblages. This cell limits the volume and area of the sample to enable easier counting and calculation of phytoplankton numbers. It consists of a brass or polystyrene rectangular frame mounted on a heavy glass slide from which a precise internal chamber has been cut; its dimensions are 50 x 20 x 1 mm
3, with an area of 1000 mm
2, and a volume of 1.0 ml. The base is ruled in a 1 mm grid. When the liquid sample is held in the cell by its large, rectangular glass cover slips, the grid subdivides 1 ml volume into microliters.

FIGURE 6.2 Schematic drawing of the Sedgewick-Rafter counting chamber.
To fill the Sedgewick-Rafter chamber, the cover slip is placed on top of the chamber, diagonally across the cell, so that the chamber is only partially covered. This helps to prevent the formation of air bubbles in the cell corners. The cover slip will rotate slowly and cover the inner portion of the cell during filling. The cover slip should not float, nor should there be any air bubbles; the former results from over-filling, the latter from under-filling the chamber. In both cases, the depth of the chamber will be different from 1 mm, and the calculations will be invalidate. A large-bore pipette should be used to transfer the sample into the chamber; after filling, the cover slip is gently pushed to cover the chamber completely. The phytoplankton sample placed into the Sedgwick-Rafter counting chamber is allowed to stand on a flat surface for 20 min to enable the phytoplankton to settle. It is then transferred to the stage of an upright light microscope and securely positioned, ready for counting.
Counts are done with the 4x or (more usually) the 10x objectives of the compound microscope (depth of field and lens length preclude the use of higher magnification objectives). A Whipple disk is inserted into one of the ocular lenses in order to provide a sample grid. It is necessary to first determine the area (A) of the Whipple field for each set of ocular and objective lenses used. This is accomplished with a stage micrometer.
There are 50 fields in the length and 20 fields in the width of the chamber (comprising a total of 1000 fields). A horizontal strip corresponds to 50 fields. All cells within randomly selected fields are counted. A convention needs to be followed for cells or units lying on a boundary line or field, such as all cells or units overlapping the right hand and top boundary are counted, but those overlapping the bottom and left hand boundary are not. The number of units per milliliter for each taxon is calculated according to following formula:
where
C is the number of cells counted,
A is the area of field in mm
2,
D is the depth of a field (Sedgewick-Rafter chamber depth) in mm, and
F is the number of fields counted. For colonial taxa multiply the count of units by the average number of cells per unit and use the resulting value as
C in Equation (
6.3). To adjust for sample concentration of dilution the result is divided or multiplied by the appropriate factor. To obtain total cell density per milliliter, sum all counts of individual taxa.
If cell density is low (<10 units per field) counting of long transects to cover a large proportion of the chamber floor is more appropriate. Several transects with a width of a chamber field are counted. The number of strips depends on the required precision and the phytoplankton density. The number of cells per millimeter is calculated according to the following formula:
where
C is the number of cells counted,
L is the length of strip in mm,
D is the depth of a field
(Sedgewick-Rafter chamber depth) in mm, W is the width of strip in mm, and
S is the number of strips counted. To adjust for sample concentration or dilution the result is divided or multiplied by the appropriate factor.
A “high-tech” alternative to counting algae in mixed assemblages with the Sedgewick-Rafter cell is the inverted microscope method. The expensive component here is the inverted microscope, whose great advantage is that settling chamber depth does not preclude the use of high magnification objective lenses. In 1931, Utermo¨hl solved the problem of concentrating and enumerating algae in mixed populations when he described a one step settling and enumeration technique using the inverted microscope. The procedure involved the gravitational sedimentation of preserved phytoplankton into a counting chamber. This counting technique correctly assumed that phytoplankton would fall randomly to the bottom of the chamber and that counts would then be made on random fields or transects. The inverted microscope counting technique has gained broad popularity for phytoplankton enumeration. One of the advantages of this randomized counting technique is the capability of calculating error estimates to verify the accuracy of the enumeration. Through the years, many modified chambers have been designed and used with the inverted microscope.
Special and expensive “Utermo¨hl” chambers can be purchased, but cheaper ones can be constructed from large cover slips, and plastic syringe barrels. If a long focal-length lens is available, chambers may be constructed from glass slides.
A measured volume of preserved sample is added to the settling chamber and allowed to settle for at least an hour. Time periods as long as 24–48 h are preferred, especially if small algae are present in the sample (these will settle only very slowly). Upon settling, the upper portion of the chamber is removed and replaced with a glass plate. The sample is then transferred to an inverted
microscope (condenser numerical aperture 0.70; objectives 25 x and 40x; oculars 12.5x) with phase contrast optics.
The sample is initially enumerated at 500 x using a random fields technique. A minimum of 20 random fields and 200 individual cells are enumerated. Additional fields are counted until the minimum count is attained. When there is a large number of cells of a particular taxon in a sample, fewer than 20 random fields are enumerated with a minimum of five random fields examined for this taxon. Individual cells are enumerated, whether in chains, filaments, or colonies. This allows for a more accurate estimate of biomass which is determined from the cell densities. Upon achieving 20 random fields and 200 individual cells, a low magnification scan (25x) of 20 random fields is used to estimate the rarer, larger forms within the sample.

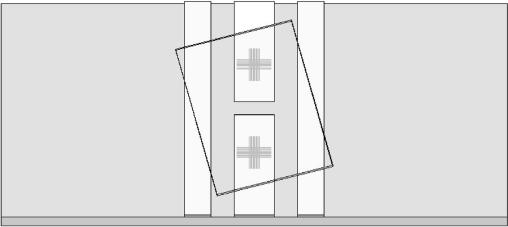
FIGURE 6.3 Schematic drawing of the Thoma counting chamber.
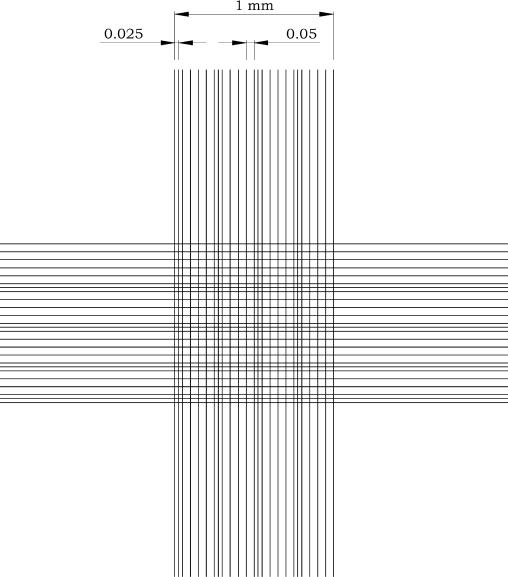
In the case of unialgal samples (unicells, small colonies, or relatively short filaments) chambers such as the haemacytometer, the Thoma chamber (Figure 6.3), the Fuchs-Rosenthal or the Burker chambers are effective and commonly used for estimating the densities of cultures. The hematocytometer was developed for counting cells in blood samples (now this is mostly done with electronic particle counters). Most of these counting chamber have delicate, mirrored surfaces that must not be scratched. Each mirrored surface has a grid etched upon the surface. In the case of Thoma chamber each grid is composed of 16 fields of 0.2 mm side, separated by three boundary lines (Figure 6.4). These 16 fields are further subdivided into 16 smaller areas each, for a total of 256 counting fields. The chamber is 0.1 mm deep; hence each grid holds exactly 64 x 10
-3 ml of sample. You have the choice of counting the algae in the entire grid; counting algae in only one of the 16 squares, then multiplying by 16; or counting algae in an even smaller area and multiplying accordingly.

FIGURE 6.3 Schematic drawing of the Thoma counting chamber.

FIGURE 6.4 Schematic drawing of the Thoma chamber ruling.
When counting cell in the entire grid, that is, 16 fields, the cell concentration is calculated according to the following formula:
where
C is the number of cells counted.
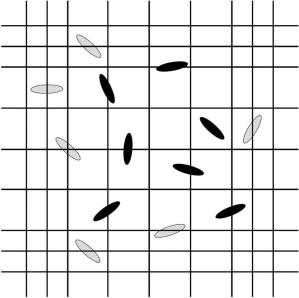
Counts of about 30 cells per field are desirable for accuracy. If there are more than 30 cells per field, dilute the sample, or count algae in a lower number of fields and multiply. As for the Sedgewick-Rafter a convention needs to be followed for cells lying on a boundary line or field, such as all cells overlapping the right hand and top boundary are counted, but those overlapping
the bottom and left hand boundary are not (Figure 6.5). The counting process has to be repeated at least ten times to determine an accurate mean.

FIGURE 6.5 Schematic drawing of the counting convention: all cells overlapping the right-hand and top boundary are counted (black cells), but those overlapping the bottom and left-hand boundary are not (gray cells).
“High-tech” methods for counting unialgal samples are the electronic particle counter (e.g., Coulter counter) and the digital microscopy. In spite of relatively high cost, an electronic particle counter is highly recommended for performing growth or bioassay studies that require many counts and high accuracy. In addition, the instrument will provide particle size/biovolume distributions. The principle of operation is that particles, suspended in an electrolyte solution, are sized and counted by passing them through an aperture having a particular path of current flow for a given length of time. As the particles displace an equal volume of electrolyte in the aperture, they place resistance in the path of the current, resulting in current and voltage changes. The magnitude of the change is directly proportional to the volume of the particle; the number of changes per unit time is proportional to the number of particles in the sample. When opened, the stopcock introduces vacuum into the system, draws sample through the aperture, and unbalances the mercury in the manometer. The mercury flows past the “start” contact and resets the counter to zero. When the stopcock is closed, the mercury starts to return to its balanced position and draws sample through the aperture. Variously sized aperture tubes are available for use in counting variously sized particles; the aperture size is chosen to match that of particles.
Digital microscopy necessitates of a microscope equipped with a digital TV camera connected to a personal computer running dedicated application software for cell recognition and cell counting. It represents an automatic, reliable, and very fast approach to growth determination.
Growth Rate and Generation Time Determinations
Growth curves are prepared from cell density data obtained with a hemocytometer or electronic particle counter on cultures sampled at intervals, such as once per day, depending on the growth rate of the alga. Plots of number of cells against time (in days) can be made, and from these curves can be calculated specific growth rate or growth constant (µ) and division or generation time (T
g).
A typical growth curve will show a lag phase, an exponential or log phase, and a stationary or plateau phase, where increase in density has leveled off. In the stationary phase, growth is likely limited by resources such as light or nutrients. Growth rate (µ) is calculated with the following equation:
where
N2 and
N1 are number of cells at times t
2 and t
1.
When
N2 is twice
N1, for example, the population has undergone a doubling, the growth rate can be expressed as
As ln(2) is equal to 0.6931, generation time can be calculated with the following equation:
 (6.2)
(6.2) (6.3)
(6.3) (6.4)
(6.4) (6.5)
(6.5) (6.6)
(6.6) (6.7)
(6.7)


