Immunofluorescence Microscopy of Cultured Cells
 |
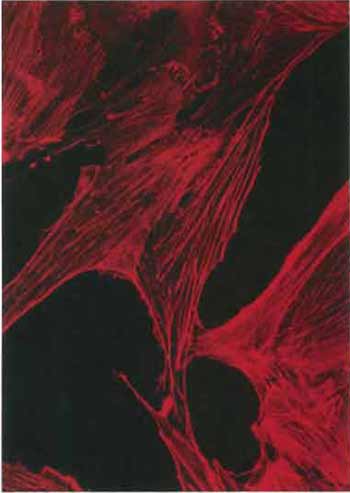
| FIGURE 1 Actin stress fibers in the RMCD rat mammary cell line revealed by staining with rhodamine-labeled phalloidin (×400). |
Immunocytochemistry is the method of choice for locating an antigen to a particular structure or subcellular compartment provided that an antibody specific for the protein under study is available. Immunofluorescence is a sensitive method requiring only one available antigenic site on the protein. Usually the indirect technique is used. In this technique the first antibody is unlabeled and can be made in any species. After it has bound to the antigen, a second antibody, made against IgGs of the species in which the first antibody is made and coupled to a fluorochrome such as fluoroscein isothiocyanate, is added. The distribution of the antigen can then be viewed in a microscope equipped with the appropriate filters.
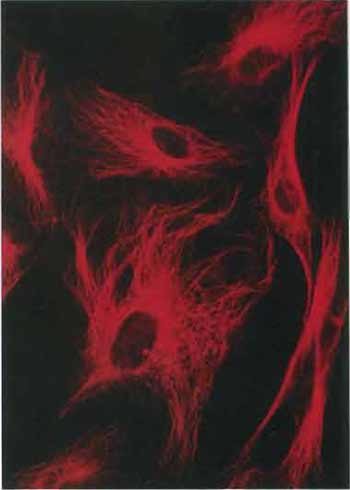
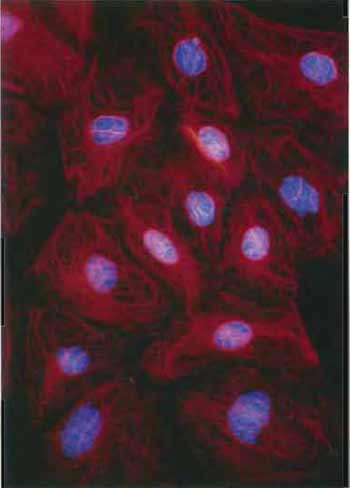
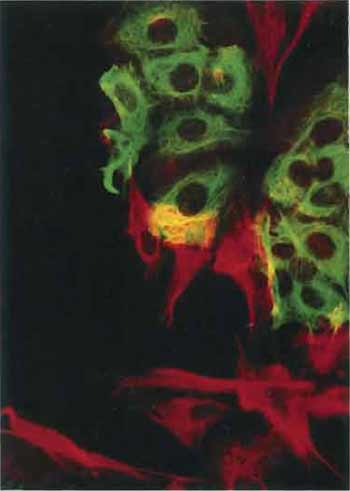
Immunofluorescence as a method to study cytoarchitecture and subcellular localization gained prominence with the demonstration that antibodies can be produced to actin even though it is a ubiquitous component of cells and tissues (Lazarides and Weber, 1974). Cytoskeletal structures visualized in cells in immunofluorescence microscopy include the three filamentous systems: microfilaments, microtubules, and intermediate filaments (Figs. 1-4 and micrographs in the article by Prast et al.). In addition, proteins can be located to other cellular subcompartments and organelles, e.g., the plasma or nuclear membranes, the Golgi apparatus, or the endoplasmic reticulum, or to other cellular structures such as mitochondria and vesicles. Other proteins can also be localized to subcompartments of the nucleus or even of the nucleolus. In addition to its use in identifying cytoskeletal structures and organelles, immunocytochemistry has proved useful in building up a biochemical or protein chemical anatomy of a structure. Examples include the location of the microfilament-associated proteins to the stress fiber and the description of the biochemical anatomy of such structures as microvilli and stereo cilia. A third use of the technique has been to demonstrate heterogeneity in mixed cultures, e.g., of neuronal cultures (Raft et al., 1978), or of other primary or secondary cell cultures (cf. Fig. 4).
The micrographs that accompany this article show not only the beauty of some of the structures, but also some of the advantages of the technique. First, only the arrangement of the particular protein against which the antibody is made is visualized. Second, for those proteins that form part of a supramolecular structure, the arrangement of such structures throughout the cell is revealed. Third, numerous cells can be visualized at the same time, and therefore it is relatively easy to determine how the structures under study vary under particular conditions or during different phases of the cell cycle. Immunofluorescence microscopy is also a useful method to establish appropriate conditions to study a structure at higher resolution in the electron microscope.
 |
| FIGURE 2 Microtubules in cells in culture revealed by staining with antibodies to tubulin followed by a rhodamine-labeled second antibody (×400). |
Other reviews of immunofluorescence of cultured cells that concentrate on methods include those of Osborn (1981), Osborn and Weber (1981), and Wheatley and Wang (1981) and for live cells, Wang and Taylor (1989) and Prast et al. (2004). Alternatively, see Allan (2000). For an overview of the different cytoskeletal and motor proteins, see Kreis and Vale (1999). For interesting collections of color immunofluorescence micrographs from a wide variety of organisms, see Haugland et al. (2004) or the BioProbes newsletter (http://www.probes.com).
II. MATERIALS AND INSTRUMENTATION
A. Antibodies
Antibodies to many cellular proteins can be purchased commercially. Firms offering a variety of antibodies to cytoskeletal and other proteins include Amersham, Biomakor, Dako, Novocastra, Sigma- Aldrich, and Transduction Laboratories; other firms have specialized collections emphasizing narrower areas.
 |
| FIGURE 3 Keratin filaments in the rat kangaroo PtK2 cell line revealed by staining with antibodies to keratin and a rhodaminelabeled second antibody. DNA has been counterstained with Hoechst dye (×150). |
Antibodies other than IgMs should be stored in the freezer (-70°C for valuable primary antibodies and affinity-purified antibodies, -20°C for the rest). Antibodies should be stored in small aliquots and repeated freezing/thawing should be avoided. IgMs may be inactivated by freezing/thawing and are best kept in 50% glycerol in a freezer set at -20 to-25°C. If dilutions are made in a suitable buffer [e.g., phosphatebuffered saline (PBS), 0.5mg/ml bovine serum albumin, 10-3M sodium azide], diluted antibodies are stable for several months at 4°C.
B. Reagents and Other Useful Items
Methanol is of reagent grade. Formaldehyde can be diluted 1:10 from a concentrated 37% solution (e.g., Analar grade BDH Chemicals). As such solutions usually contain 11% methanol, it may be better to make the formaldehyde solution from paraformaldehyde. In this case, heat 18.5 g paraformaldehyde in 500ml PBS on a magnetic stirrer to 60°C and filter through a 0.45- µm filter. Store at room temperature. PBS contains per liter 8 g NaCl, 0.2 g KCl, 0.2 g KH2PO4, and 1.15 g Na2HPO4, adjusted to pH 7.3 with NaOH.
 |
| FIGURE 4 Artificial mixture of cells from the human breast carcinoma cell line MCF-7 and the human fibroblast cell line HS27 stained with an antibody to keratin (in green) and with the V9 antibody to vimentin (in red). Note that each cell type contains only a single type of intermediate filament. The yellow color results from MCF-7 and HS27 cells that lie over each other (×150). |
Other useful items include round (12mm) or square (12 × 12mm) glass coverslips (thickness 1.5). Ten round coverslips fit in a petri dish of 5.5cm diameter. For screening purposes or when a large number of samples is needed (e.g., for hybridoma screening), microtest slides that contain 10 numbered circles 7mm in diameter (Flow Labs, Cat. No. 6041505) are useful. Tweezers (e.g., Dumont No. 7) are used to handle the coverslips. Ceramic racks into which coverslips fit (Thomas Scientific, Cat. No. 8542E40) and glass containers in which these racks fit are also needed. Glass beakers (30ml) are used to wash the specimens. Cells growing in suspension can be firmly attached to microscope slides using a cytocentrifuge such as the Cytospin 2 (Shandon Instruments).
C. Equipment
The essential requirement is access to a microscope equipped with appropriate filters to visualize the fluorochromes in routine use. Microscopes with CCD or digital cameras so that results can be viewed directly on screen are available from several manufacturers, e.g., Zeiss. Epifluorescence, an appropriate highpressure mercury lamp (HBO 50 or HBO 100) and appropriate filters (so that specimens doubly labeled with, e.g., fluorescein and rhodamine can be visualized) are basic requirements. Lenses should also be selected carefully. The depth of field of the lens will decrease as the magnification increases. Round cultured cells will be in focus only with a ×25 or ×40 lens, whereas flatter cells can be studied with a ×63 or ×l00 lens. To enable phase and fluorescence to be studied on the same specimen, some lenses should have phase optics. Only certain lenses transmit the Hoechst DNA stain (e.g., Neofluar lenses), and this stain also requires a separate filter set.
III. INDIRECT IMMUNOFLUORESCENCE PROCEDURE
Steps
- Trypsinize cells 1-2 days prior to the experiment onto glass coverslips or on multitest slides that have been washed in 100% ethanol and oven sterilized. For most applications, choose coverslips or multitest slides on which cells are two-thirds or less confluent. Drain coverslip or touch to filter paper to remove excess medium, but do not allow it to dry.
- Place coverslips in a ceramic rack and multitest slides in metal racks, and immerse in methanol precooled to -10 to -20°C. Leave for 6min at room temperature.
- Make a wet chamber by lining a 13-cm-diameter (for coverslips) or a 24 × 24-cm2 petri dish (for slides) with two or three sheets of filter paper and add sufficient water to moisten the filter paper. Numbers identifying the samples can be written on the top sheet of filter paper prior to wetting it.
- Wash the fixed specimens briefly in PBS, remove excess PBS by touching to dry filter paper, and place cell side up over the appropriate number in the wet chamber.
- Add 5-10µl of an appropriate dilution of the primary antibody with an Eppendorf pipette. Use the tip to spread the antibody over the coverslip without touching the cells. Replace the top of the wet chamber, transfer to a humidified incubator at 37°C, and incubate for 45 min.
- Wash by dipping each coverslip individually three times into each of three 30-ml beakers containing PBS. Wash slides by replacing slides in metal rack and transferring through three PBS washes (180ml each, leave for 2 min in each). Remove excess PBS with filter paper.
- Replace specimens in wet chamber. Add 5-10µl of an appropriately diluted second antibody carrying a fluorescent tag. Return to 37°C incubator for a further 30-45 min.
- Repeat step 6.
- Identify microscope slides with small adhesive labels on which date, specimen number, antibody, or other information is written. Place slides in cardboard microslide folders (e.g., Thomas Scientific, Cat. No. 6708-M10). Mount two coverslips per slide by inverting each coverslip and placing cell side down on a drop of mounting medium placed on the slide, with a disposable ring micropipette. Cover with filter paper and press gently to remove excess mounting medium. For samples on multitest slides, use 6 × 2.5-cm glass coverslips on which a drop of mounting medium has been placed. Secure the coverslips with nail polish. Store samples in the dark in slide boxes at 4°C.
- Documentation. Use a fast film (e.g., Kodak 35mm Tri-X) and push the development, e.g., with Diafine (Acufine), or record the image digitally. Phase micrographs of specimens embedded in Mowiol should be made as soon as possible after mounting the specimens. The fluorescence decreases a little in the first few days, but is then stable for years if the samples are stored in the dark at 4°C.
Specimens should not be allowed to dry out at any stage in the procedure. If coverslips are dropped accidentally, the side on which the cells are can be identified by focusing on the cells under an upright microscope and scratching gently with tweezers.
A. Fixation
The procedure gives good results with many cytoskeletal and other antigens; however, the optimal fixation protocol depends on the specimen, the antigen, and the location of the antigen within the cell. Three requirements have to be met. First, the fixation procedure must retain the antigen within the cell. Second, the ultrastructure must be preserved as far as possible without destroying the antigenic determinants recognized by the antibody. Third, the antibody must be able to reach the antigen; i.e., the fixation and permeabilization steps must extract sufficient cytoplasmic components so that the antibodies can penetrate into the fixed cells. In the procedure just given, fixation and permeabilization are achieved in a single step, i.e., with methanol. Alternative fixation methods include the following:
- Formaldehyde-methanol: 3.7% formaldehyde in PBS for 10min (to fix the cells) and then methanol at -10°C for 6 min (to permeabilize the cells).
- Formaldehyde-Triton: 3.7% formaldehyde in PBS for 10min (to fix) and then PBS with 0.2% Triton X-100 for I min at room temperature (to permeabilize).
- Glutaraldehyde: Fix in 1% glutaraldehyde (electron microscopic grade) in PBS for 15min and then methanol at -10°C for 15min. Immerse in sodium borohydride solution (0.5 mg/ml in PBS made minutes before use) for 3 × 4 min. Wash with PBS 2 × 3 min each. Note that the sodium borohydride step is necessary to reduce the unreacted aldehyde groups; without this step the background will be very high.
B. Special Situations
- Fluorescently labeled phalloidin (extremely poisonous), a phallotoxin that binds to filamentous actin, is available commercially and is usually used to reveal the distribution of filamentous actin in cells (Fig. 1). To obtain good staining patterns, fix cells for 10min in 3.7% formaldehyde in PBS. Wash with PBS. Incubate for l min in 0.2% Triton X-100 in PBS and wash with PBS. Incubate with an appropriate dilution of rhodamine-labeled phalloidin (e.g., Sigma Cat. No. P-1951) for 30min at 37~ wash with PBS, and mount in Mowiol. Note that phalloidin staining will not work after methanol fixation (for further discussion, see article by Prast et al., and Small et al., 1999).
- To stain endoplasmic reticulum, use either an antibody, e.g., ID3 against a sequence region of protein disulfide isomerase (Vaux et al., 1990), or the lipophilic, cationic fluorescent dye DiOC6 (3,3- dihexyloxacarbocyanine iodide, Kodak Cat. No. 14414) (Terasaki et al., 1984). To stain with dye, fix for 5 min in 0.25% glutaraldehyde in 0.1M cacodylate and 0.1M sucrose buffer, pH 7.4. Wash. Stain for 80s with dye, mount in buffer, and observe using a ×63 or ×l00 lens and the fluorescein filter. Reticular structures should be apparent. Note that mitochondria will also be stained. To stain only mitochondria, use either an antibody, e.g., to cytochrome oxidase, or the dye rhodamine 123.
- Special fixation procedures may also be needed for other membrane structures in cells. In addition, lectins can be used to stain carbohydrate-containing organelles, e.g., staining of Golgi apparatus with fluorescently labeled wheat germ or other agglutinins.
- To stain DNA for fluorescent applications dyes that bind to the minor groove in DNA such as the Hoechst dyes and DAPI are usually used. To stain with Hoechst use either Hoechst 33242 (Sigma Cat. No. 2261) or Hoechst 33258 (Sigma Cat. No. B2883). Note that Hoechst 33242 can also be used to stain DNA in live cells. When bound to DNA, Hoechst dyes fluoresce bright blue (cf. Fig. 1C). To stain with Hoechst prepare a 1 mM stock solution in sterile water and store at 4°C. To stain cells dilute the stock solution 1: 1000 in PBS to a final working concentration of 1 µM. After step 8 in the immunofluorescence procedure, pipette 20-100µl of the working solution onto each coverslip and leave for 4min at room temperature. Wash twice with PBS, drain the coverslip, and mount in Mowiol. DNA can also be stained with DAPI, which shows a 20-fold fluorescence enhancement on binding to DNA and also gives blue fluorescence.
- Some cellular structures, such as microtubules, are sensitive to calcium. In this case, add 2-5mM EGTA to the 3.7% formaldehyde solution in Section IV, A and to the methanol in Section III, step 2.
- Blocking steps are usually not necessary if antibodies are diluted in BSA containing buffers. If a blocking step is used it should be performed after fixation and prior to adding the first antibody. Blocking to reduce nonspecific staining is performed with 10% serum from the same host species as the labeled antibody.
- Sometimes for cell surface components it may be advantageous to stain live cells. Expose such cells to antibody for 25min and proceed with steps 6-8 in Section III. Then fix cells in 5% acetic acid/95% ethanol for 10 min at -10°C (Raft et al., 1978).
- Another application of immunofluorescence microscopy is to monitor directly the distribution of fluorescently labeled proteins in live cells by video microscopy (e.g., Sammak and Borisy, 1988).
C. Double or Triple Immunofluorescence Mircroscopy
It is often advantageous to visualize two or three antigens in the same cell (Fig. 4). Here it is important to choose fluorophores that give good color separation, e.g., a Texas red/FITC combination will give a better separation than TRITC/FITC (see also article by Prast et al.). Most important is that the microscope is optimized for the fluorophores in use by the selection of the appropriate filters so that there is no overlap between the channels used to observe each of the fluorophores.
Fluorescence microscopy gives an overview of the whole cell. With practice, specimens can be seen in three dimensions when looking through a conventional microscope. Stereomicrographs can be made using a simple modification of commercially available parts (Osborn et al., 1978a). Today, however, confocal microscopy is the method of choice and is particularly useful for round cells, which are not in focus with the higher-power ×63 or ×l00 lenses, or to document arrangements and obtain greater resolution at multiple levels in the same cell or organism (cf. Fox et al., 1991).
E. Limit of Resolution
Theoretically, this is N200nm when 515-nm wavelength light and a numerical aperture of 1.4 are used. Objects with dimensions above 200nm will be seen at their real size. Objects with dimensions below 200nm can be visualized provided they bind sufficient antibody, but will be seen with diameters equal to the resolution of the light microscope (cf. visualization of single microtubules in Osborn et al., 1978b). Objects closer together than 200-250 nm cannot be resolved by conventional fluorescence microscopy, e.g., microtubules in the mitotic spindle or ribosomes. However, some increase in the resolution of fluorescent images can be obtained using new forms of microscopy (see Hell, 2003).
Immunofluorescence microscopy is an important technique not only for fixed cells (this article), but also because of the possibility of expressing GFP vectors coupled to particular constructs in living cells (see article by Prast et al.) and following changes in distribution by video microscopy. FRET imaging techniques (see this volume) and other novel techniques, such as the use of quantum dot ligands (e.g., Lidke et al., 2004), are also opening up new possibilities for more quantitative fluorescence measurements on live cells.
V. PITFALLS
Occasionally no specific structures are visualized, even though the cell is known to contain the antigen. This may be because:
- Antibodies can be species specific. This can be a particular problem with monoclonal antibodies, which, for instance, may work with human but not with other species. If in doubt, check the species specificity with the supplier before purchase.
- The fixation procedure may inactivate the antigen. For instance, many intermediate filament antibodies no longer react after fixation protocols such as those in Section IV, A.
- The antigen may be present only at very low concentrations and therefore it may be necessary to use more sensitive methods to detect the antigen.
- The antigen can be poorly fixed or extracted by the fixation procedure.
- The antibody may not be able to gain access to the antigen, e.g., antibodies to tubulin often do not stain the midbody of the intracellular bridge.
- The specimens may be generally fluorescent and it can be hard to decide whether this is due to specific or nonspecific staining.
Allan, V. J. (2000). Basic immunofluorescence. In "Protein Localisation by Fluorescence Microscopy: A Practical Approach," pp. 1-26. Oxford Univ. Press, New York.
Fox, M. H., Arndt-Jovin, D. J., Jovin, T. M., Baumann, P. H., and Robert-Nicoud, M. (1991). Spatial and temporal distribution of DNA replication sites localized by immunofluorescence and confocal microscopy in mouse fibroblasts. J. Cell Sci. 99, 247-253.
Haugland, R. P. (2004). Molecular probes. In "Handbook of Fluorescent Probes and Research Products," 9th Ed.
Hell, S. W. (2003). Toward fluorescence nanoscopy. Nature Biotechnol. 21, 1347-1355.
Kreis, T., and Vale, R. (1999). "Guidebook to the Cytoskeletal and Motor Proteins," 2nd Ed. Oxford Univ. Press, London.
Lazarides, E., and Weber, K. (1974). Actin antibody: The specific visualization of actin filaments in non-muscle cells. Proc. Natl. Acad. Sci. USA 71, 2268-2272.
Mason, W. T. (1999). "Fluorescent and Luminescent Probes for Biological Activity." Academic Press, San Diego.
Osborn, M. (1981). Localization of proteins by immunofluorescence techniques. Techniq. Cell. Physiol. P107, 1-28.
Osborn, M., Born, T., Koitzsch, H. J., and Weber, K. (1978a). Stereo immunofluorescence microscopy. I. Three-dimensional arrangement of microfilaments, microtubules and tonofilaments. Cell 13, 477-488.
Osborn, M., and Weber, K. (1981). Immunofluorescence and immunochemical procedures with affinity purified antibodies. In"Methods in Cell Biology," Vol. 23. Academic Press, New York.
Osborn, M., Webster, R. E., and Weber, K. (1978b). Individual microtubules viewed by immunofluorescence and electron microscopy in the same PtK2 cell. J. Cell Biol. 77, R27-R34.
Pruss, R. M., Mirsky, R., Raft, M. C., Thorpe, R., Dowding, A. J., and Anderton, B. H. (1981). All classes of intermediate filaments share a common antigenic determinant defined by a monoclonal antibody. Cell 27, 419-428.
Raft, M. C., Mirsky, R., Fields, K. L., Lisak, R. P., Dorfman, S. H., Pilbenberg, D. H., Gregeon, N. A., Leibowitz, S., and Kennedy, M. C. (1978). Galactocereboside is a specific cell surface antigenic marker for oligodendrocytes in culture. Nature 274, 813-816.
Sammak, P. J., and Borisy, G. G. (1988). Direct observation of microtubule dynamics in living cells. Nature 332, 724-726.
Small, J. V., Rottner, K., Hahne, P., and Anderson, K. I. (1999). Visualising the actin cytoskeleton. Microsc. Res. Tech. 47, 3-17.
Terasaki, M., Song, J., Wong, J. R., Weiss, M. J., and Chen, L. B. (1984). Localization of endoplasmic reticulum in living and glutaraldehyde fixed cells with fluorescent dyes. Cell 38, 101-108.
Vaux, D., Tooze, J., and Fuller, S. (1990). Identification by antiidiotype antibodies of an intracellular membrane protein that recognizes a mammalian endoplasmic reticulum retention signal. Nature 345, 495-502.
Wang, Y. L., and Taylor, D. L. (1989). "Methods in Cell Biology," Vols. 29 and 30. Academic Press, New York.
Wheatley, S. P., and Wang, Y. L. (1998). Indirect immunofluorescence microscopy in cultured cells. Methods Cell Biol. 57, 313-332.


