Systematic Subcellular Localization of Novel Proteins
The completion of several genome sequencing projects now reveals many thousand open reading frames (ORFs) encoding novel proteins of unknown function. One of the major challenges in the next years will be to allocate functional data to each of these new proteins and to determine how they interact with each other to form the complex regulatory networks underlying fundamental processes of life and disease. Determining the subcellular localisation of these novel ORFs is one important step to be taken in order to bridge the gap between known sequence and unknown function. One way to achieve this may be to systematically raise protein specific antibodies and use them subsequently to determine localisation by immunofluorescence microscopy. However, raising antibodies on such a scale is laborious and expensive. A good alternative to subcellular localisation by immunofluorescence using antibodies is the tagging of the novel ORFs with the green fluorescent protein (GFP) or its spectral variants (Tsien, 1998, 1998, 2002; Zhang et al., 2002) followed by subcellular localisation of the GFP-tagged fusion proteins in living cells or multicellular organisms (Ding et al., 2000; Simpson et al., 2000). This approach has now become much simpler and faster by advances in restriction enzyme-free cloning methods, such as the Gateway system from Invitrogen (Walhout et al., 2000), which enable hundreds of defined ORFs to be transferred into GFP vectors in a matter of days. GFP tagging is not only less expensive and perhaps faster, but has the critical advantage compared to immunofluorescence that the expressed GFP fusion proteins can be localised in living samples, which reduces the risk of artefacts caused by fixation and subsequent permeabilisation as is necessary for immunofluorescence.
II. EXPERIMENTAL STRATEGY
Our experimental strategy to systematically localise novel proteins is summarised schematically in Fig. 1. It is based on tagging of the respective cDNAs with the GFP and subsequent expression and localisation of the GFP fusion proteins in living and fixed cells. We start the subcellular localisation procedure with bioinformatic analyses of the sequences under study in order to identify organelle-specific targeting sequences or related proteins of which the localisation has already been determined. These data are always considered alongside the final experimental results obtained.
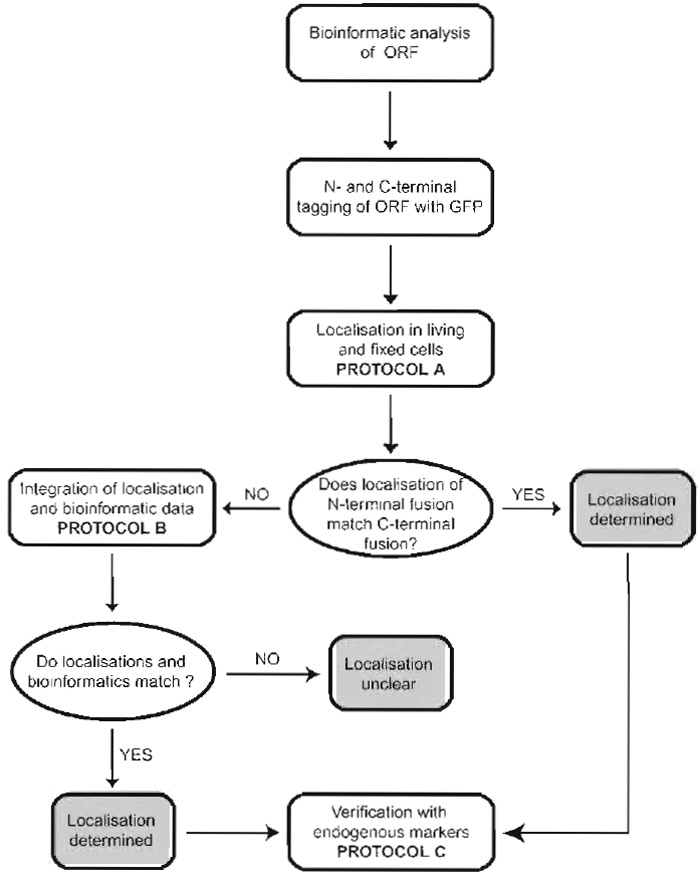 |
| FIGURE 1 Experimental strategy to systematically localise novel proteins in cells. For details, see text. |
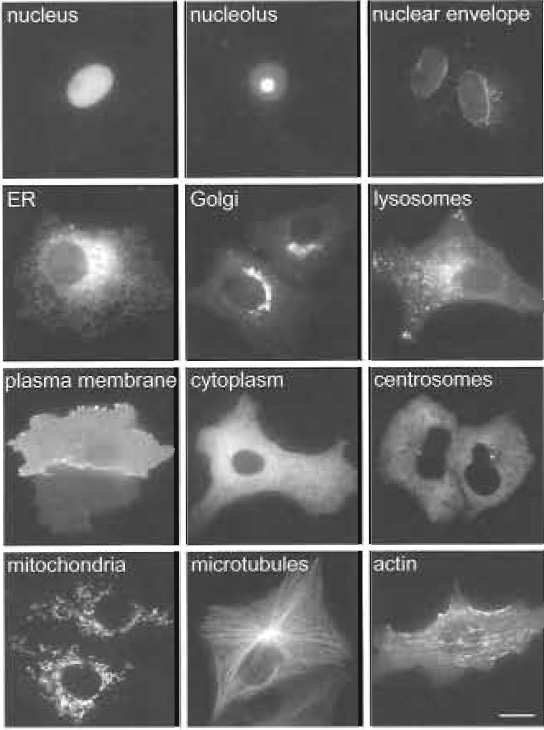 |
| FIGURE 2 Examples of subcellular localise observed in live Vero cells. Vero cells expressing a variety of GFP-tagged proteins localise to different sub-cellular compartments. More examples of localisations can be seen at http://gfp-cdna.embl.de. Bar: 10 µm. |
Because localisation is wholly dependent upon targeting sequences within the protein of interest, tagging of a protein with GFP always carries the risk that these targeting sequences become masked, which will finally lead to a mislocalisation of the tagged protein. We address this problem by tagging the proteins separately at their N and C termini and determining the localisation of both fusion proteins. If N- and C-terminal fusions show identical localisation patterns, one can be confident that the subcellular localisation determined is correct. If the N- and C-terminal fusions give different results, data are considered with respect to the bioinformatic predictions. The localisation that best matches the bioinformatic data is then considered as the correct one. Finally, data are verified by colocalisation of the GFP fusion proteins with established endogenous organelle-specific markers.
Localisation studies can be performed in a variety of cultured cell lines, the choice of which should preferably match the source of the ORFs. However, we prefer to use the monkey kidney fibroblast cell line, Vero (ATCC CCL-81), as these cells have the advantages that they are large in diameter (about 60µm), display a very clear subcellular morphology (see examples shown in Fig. 2), and are particularly flat, which makes them ideal for imaging using wide-field fluorescence microscopy. Furthermore, we have so far observed no discrepancies of protein localisations in these cells compared to HeLa (ATCC CCL-2) cells, which are of human origin. In cases where a clear localisation of the GFP-tagged fusion protein to a cellular compartment or structure is difficult to achieve in Vero or HeLa cells, we use more specialised cell types for the localisation experiments, such as rat primary hippocampal neurons or SH-SY5Y human neuroblastoma cells (ATCC CRL-2266), when the protein under investigation is, for example, derived from a brain-specific cDNA library.
Vero cells (ATCC CCL-81) are grown in minimal essential medium (MEM) containing Earle's salts (Cat. No. 21090-022) with the addition of 2mM L-glutamine (Cat. No. 25030-024) and 100U/ml penicillin/100µg/ml streptomycin (Cat. No. 15140-122) all from Invitrogen and 10% foetal calf serum (FCS) (Cat. No. A15-043) from PAA Laboratories. Trypsin-EDTA (Cat. No. 25300-054) is from Invitrogen. Live cell imaging is performed in "Imaging Medium," consisting of MEM containing Earle's salts but lacking phenol red, FCS, and antibiotics (Cat. No. M3024) from Sigma. For transfections, OptiMEM with Glutamax (Cat. No. 51985-026) is from Invitrogen and the FuGENE6 transfection reagent (Cat. No. 1814443) is from Roche. Highpurity cycloheximide powder (Cat. No. 239764) is from Calbiochem. Methanol (Cat. No. 106009) and glycine (Cat. No. 104201) are from Merck. Paraformaldehyde (PFA) (Cat. No. P6148) and Triton X-100 (Cat. No. T9284) are from Sigma. Cy5-conjugated secondary antibodies (antimouse, Cat. No. PA45002, and antirabbit, Cat. No. PA45004) are from Amersham Biosciences. Alexa Fluor647-conjugated secondary antibodies (antisheep, Cat. No. A-21448, and antigoat, Cat. No. A-21447) are from Molecular Probes. Standard cell culture plasticware is from Falcon/BD Biosciences.
Glass-bottomed live cell imaging dishes (35 mm, with 10mm number 1.5 coverglass) (Cat. No. P35G-1.5-10- C) are available from MatTek, and Lab-Tek 8-well chambered cover glass dishes (Cat. No. 155411) are from Nalge Nunc. Cells are imaged on a Zeiss Cell Observer System consisting of a Zeiss Axiovert 200 inverted microscope equipped with a Zeiss Planapochromat 63x/1.4NA objective and standard CFP (Cat. No. 1196-682), GFP (Cat. No. 1114-459), YFP (Cat. No. 1196-681), and Cy5/Alexa647 (Cat. No. 488026) filter sets. Images are captured with a CCD camera (Zeiss Axiocam) using Zeiss Axiovision 3.1 software. Images are contrast adjusted and merged using Photoshop 6.0 from Adobe.
A. Localisation of GFP-Fusion Proteins in Living and Fixed Cells
Solutions
- Prepare imaging medium by dissolving 9.4 g of the powder in 900ml water. Add 0.5g of NaHCO3, HEPES pH 7.4 to 25mM, and L-glutamine to 2mm final concentration. Adjust the pH to 7.0 with 1N NaOH, make up volume to 1 litre, and then sterilise by filtration through a 0.22-µm filter. Store in 50-ml aliquots at 4°C for up to 3 months.
- Prepare a 3% solution of PFA by dissolving 15 g of PFA powder in 400ml of phosphate buffered saline (PBS) and heating the solution to 65°C whilst stirring. When dissolved, add 50µl of 1M CaCl2 and 50µl of 1M MgCl2. Adjust pH to 7.4 with 1N NaOH, make up volume to 500ml, filter through Whatman filter paper (No. 1), and store in 10-ml aliquots at -20°C. Aliquots should not be refrozen after use.
1. Plating Cells on Live Cell Imaging Dishes
- The day prior to transfection, take a 90% confluent 10-cm dish of Vero cells and harvest the cells with 3 ml of trypsin-EDTA solution.
- Resuspend the cells in a total volume of 20ml of complete MEM growth medium.
- Use this cell suspension to prepare either individual 35-mm live cell dishes or 8-well chambered cover glass dishes.
- For the individual live cell dishes, mix 0.5 ml of the cell suspension with 1.5ml of complete MEM for each dish. For 8-well dishes, mix 0.05 ml of the cell suspension with 0.25 ml of complete MEM for each well.
- Incubate dishes in a humidified CO2 incubator at 37°C overnight.
2. Transfection of Cells
Steps
- On the day of transfection prepare the DNA and transfection reagent. Aliquot each DNA to be tested into a fresh tube, using 1µg for the individual dishes and 0.1µg for each well of the 8-well dishes.
- Into fresh tubes aliquot OptiMEM (100µl) followed by 3 µl of the FuGENE6 reagent (35-mm dishes) or OptiMEM (50 µl) followed by 0.3 µl of FuGENE6 (8- well dishes). Ensure that the transfection reagent does not come into contact with the side of the tube.
- Mix briefly by pipetting only and then incubate at room temperature for 5 min.
- Transfer the FuGENE6-OptiMEM mixture into the DNA, mix by pipetting, and incubate at room temperature for 30min.
- Add the complete transfection mixture dropwise to the cells and then mix by swirling the dishes.
- Incubate in a humidified CO2 incubator at 37°C.
Localisations of GFP-tagged proteins may change due to the expression levels and therefore we use cells expressing low and moderate levels of the protein under investigation for our localisation experiments.
Therefore, cells are imaged at various times, typically 14, 20, and 40h after transfection. This results in cells expressing low, moderate, and high amounts of the GFP-tagged proteins and gives further information how the expression level might influence localisation.
Steps
- Replace the transfection medium with an equal volume of imaging medium.
- Observe the cells on an inverted microscope using a 63x objective, taking multiple images for each plasmid transfected.
- Replace the imaging medium with the MEM growth medium and continue incubating cells in a humidified CO2 incubator at 37°C.
- Repeat steps 1 to 3 at various time points after transfection.
In parallel cultures or following image acquisition from live cells it is important to fix the cells and remove any soluble GFP signal that may be obscuring more subtle localisation patterns. The choice of fixation reagent is largely determined by the localisation pattern observed in the live cells. Paraformaldehyde, for example, allows for better fixation of small membrane structures such as endosomes. However, when appropriate, we prefer methanol as the fixative, as this is rapid and effectively removes soluble cytoplasmic GFP-tagged proteins, but leaves structures largely intact.
Steps
Methanol Fixation
- Remove the entire growth medium from the dishes.
- Plunge the entire culture dish into a glass trough containing methanol at -20°C.
- Incubate at -20°C for 4min.
- Remove dishes from the methanol and wash cells twice, 3 min each time, with room temperature PBS.
- Observe the cells still covered in PBS on an inverted microscope using a 63x objective, taking multiple images for each plasmid transfected.
Paraformaldehyde Fixation
- Replace the growth medium with a similar volume of freshly thawed PFA at room temperature.
- Incubate for 20min.
- Quench the reaction by replacing the PFA with PBS containing 30mM glycine in order to remove cell autofluorescence due to PFA fixation.
- After a 5-min incubation, wash the cells twice with PBS.
- Observe the cells on an inverted microscope using a 63x objective, taking multiple images for each plasmid transfected.
Images obtained from living and fixed cells are then inspected manually and compared to images obtained in living and fixed cells with already established GFPtagged organelle-specific markers (see examples in Fig. 2; more examples for organelle-specific localisations can be seen at http://gfp-cdna.embl.de.
B. Integration of Localisations with Bioinformatic Predictions
Having classified localisation of the GFP-tagged protein in live and fixed cells (Section IV, A), and if the N- and C-terminal fusions give the same localisation pattern, one can be relatively confident that this represents the localisation of this protein and therefore one can proceed with confirmation of the results by colocalisation of the GFP-tagged proteins with endogenous organelle-specific markers (Section IV, C). When the N- and C-terminal localisation patterns differ, bioinformatic data about the protein of interest should be consulted. In our experience, for over two-thirds of the proteins we have screened, combination of bioinformatic predictions with experimental cell localisations allows a final localisation to be concluded.
- Compare the protein sequence under investigation with all known sequences in worldwide databases. Such BLAST searches, for example, available from the NCBI (http://www.ncbi.nlm.nih.gov/ BLAST), may reveal similar proteins from other organisms for which the localisation may have already been characterised.
- Analyse the sequence for potential N-terminal targeting peptides known to direct proteins into either the secretory pathway or the mitochondria. The PSORT programme (http://psort.nibb.ac.jp) is very useful in this respect.
- Scan for any known domains within the protein of interest. The SMART programme (http://smart. embl-heidelberg.de) provides a graphical interface whereby all known proteins containing any detected domains and likely transmembrane sequences can be visualised. The links provided from these results allow the unknown protein to be put into context of other proteins of potentially similar function.
- Analyse the protein sequence for any other possible posttranslational targeting motifs such as myristoylation or prenylation consensus sites, which may also be used to target the protein to defined subcellular structures. The PROSITE programme is useful in this respect (http://www.expasy.org/prosite).
- Determine the final localisation by considering for which of the GFP fusion protein orientations (N- or C-terminal fusions) most of the bioinformatic predictions are consistent with the experimental localisation data. For example, if proteinX-GFP was seen to localise in the mitochondria, whereas GFP-proteinX displays a diffuse localisation and a mitochondrial targeting sequence is predicted, the localisation is concluded to be mitochondrial.
C. Verification of Results by Colocalisation with Endogenous Organelle-Specific Markers
1. Immunostaining of Cells
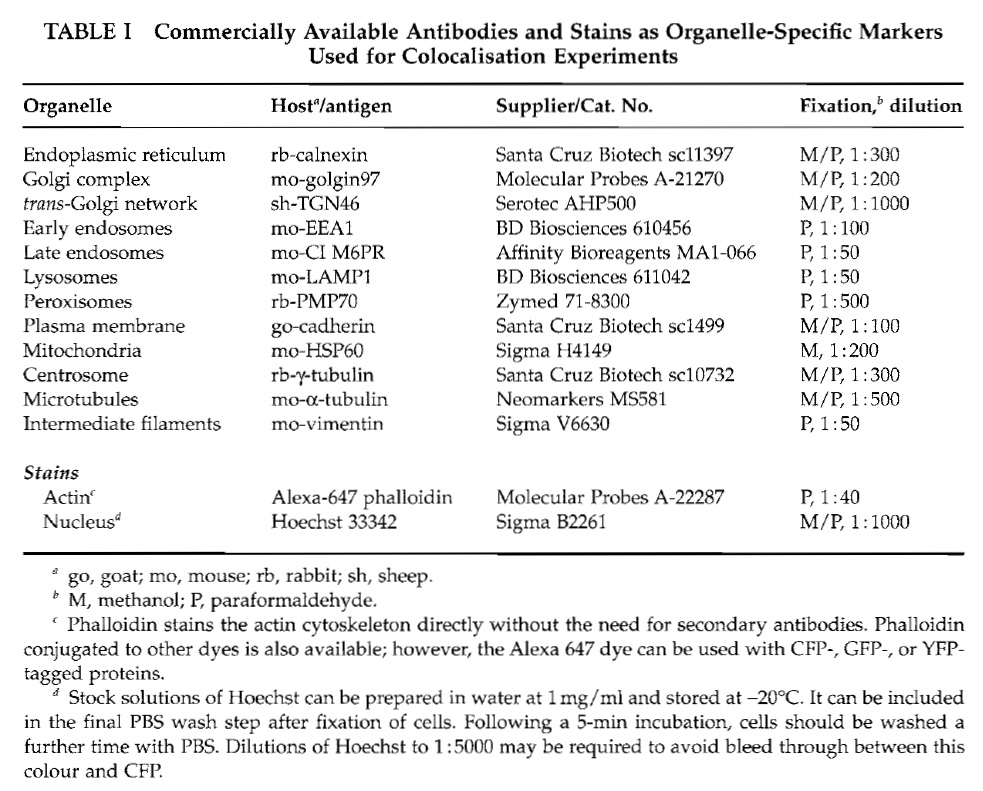
Before staining, cells are fixed with methanol or paraformaldehyde as described in Section IV, A. For verification of the localisations, we use commercially available primary antibodies recognising organellespecific marker proteins. The suppliers of these antibodies, the host animals in which they have been raised, the preferred cell fixation method giving best results, and the required antibody dilutions are summarised in Table I. The secondary antibodies we use are conjugated with Cy5 or Alexa647, which can be separated easily from YFP or CFP fluorescence using standard filter sets.
 |
- Prior to immunostaining, those cells fixed with PFA must be permeabilised. For this, incubate the cells with PBS containing 0.1% Triton X-100 at room temperature for 5 min and then wash twice with PBS.
- Prepare the organelle-specific primary antibodies in PBS at the appropriate dilution (see Table I).
- Overlay the cells with 50 µl (35-mm dishes) or 75 µl (8-well dishes) of these dilutions and incubate at room temperature for 30min.
- Remove the antibodies and wash the cells twice with PBS.
- Dilute the appropriate secondary antibodies in PBS.
- Overlay the cells with secondary antibodies as described in step 3.
- Incubate for 20min. Finally, wash cells twice with PBS, leaving them covered in PBS for imaging.
2. Analysing Colocalisation
For colocalisation of the double-labelled samples we use a Zeiss Cell Observer System for image acquisition. It is equipped with filter sets for CFP, GFP, YFP, and Cy5/Alexa647. Imaging of the two colour channels (GFP-tagged protein and Cy5/Alexa647-stained organelle marker) is performed sequentially, which has the advantage of minimising bleed through of the channels. We analyse colocalisation by merging the images acquired for the GFP-tagged protein (green) and the organelle marker (red). This is usually sufficient to accurately determine whether the suspected localisation of the GFP-tagged protein matches the one of the reference marker. However, for reasons of reliability, it is important that during image acquisition the exposure time is set such that the camera is not saturated and that the range of grey levels of the captured images covers the entire dynamic range of the imaging system (e.g., 256 on an 8-bit camera). Some image acquisition software (e.g., Axiovision) contains an autoexposure feature to ensure that this occurs.
- Position the GFP-positive cells to be imaged within the field of view and focus on the structure(s) of interest.
- Acquire an image using the autoexposure procedure.
- Change to the Cy5/Alexa647 filter position.
- Acquire an image using the autoexposure procedure. It is important not to change the focus position in steps 3 and 4.
- Overlay the two images using the Axiovision software with the GFP image as the green channel and the Cy5/Alexa647 image as the red channel.
- Inspect the overlay image visually. Colocalising structures appear yellow.
V. COMMENTS
- High-quality glass-bottomed 96-well plates are now becoming more widespread and although they are still relatively expensive, they offer the clear advantage that many more DNA-GFP constructs can be screened consecutively using less material. In our experience, however, some cell types find these plates toxic for growth, and transfection efficiencies are often significantly lower than in other dish formats, presumably due to liquid mixing problems in this shape of well.
- A wide variety of transfection reagents are available from different suppliers, with the choice of which reagent to use being largely governed by the cell line. Generally we have found that when screening large numbers of DNA molecules, it is best to choose a reagent with a simple protocol that works efficiently in the presence of serum.
- Novel proteins of the secretory pathway often display heterogeneity of localisations (endoplasmic reticulum, Golgi complex, endosomal/lysosomal system, plasma membrane) when examined. In such cases it is important to perform a cycloheximide chase of the newly synthesised GFP-tagged proteins to try to determine their final compartment of residence. This is achieved by the addition of 100µg/ml cycloheximide to the growth medium (stock solutions are prepared at 100mg/ml in methanol or ethanol and stored at -20°C) followed by imaging the cells at regular intervals (every 2 h) up to 8 h after drug treatment. This chase time is usually sufficient to ensure that even large cell surface proteins have time to fold and are able to transit the entire secretory pathway, reaching their final destination.
Bastiaens, P. I., and Pepperkok, R. (2000). Observing proteins in their natural habitat: The living cell. Trends Biochem. Sci. 25, 631-637.
Ding, D. Q., Tomita, Y., Yamamoto, A., Chikashige, Y., Haraguchi, T., and Hiraoka, Y. (2000). Large-scale screening of intracellular protein localization in living fission yeast cells by the use of a GFP-fusion genomic DNA library. Genes Cells 5, 169-190.
Simpson, J. C., Wellenreuther, R., Poustka, A., Pepperkok, R., and Wiemann, S. (2000). Systematic subcellular localisation of novel proteins identified by large-scale cDNA sequencing. EMBO Rep. 1, 287-292.
Tsien, R. Y. (1998). The green fluorescent protein. Annu. Rev. Biochem. 67, 509-544.
Walhout, A. J. M., Sordella, R., Lu, X., Hartley, J. L., Temple, G. F., Brasch, M. A., Thierry-Mieg, N., and Vidal, M. (2000). Protein interaction mapping in C. elegans using proteins involved in vulval development. Science 287, 116-122.
Zhang J., Campbell, R. E., Ting, A. Y., and Tsien, R. Y. (2002). Creating new fluorescent probes for cell biology. Nature Rev. Mol. Cell Biol. 3, 906-918.
Support our developers


