Ultraviolet Laser Microbeam for Dissection of Drosophila Embryos
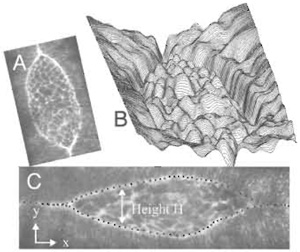
Laser microbeams provide a unique opportunity to augment traditional genetic and cell biological analysis of biological phenomena with surgical studies that selectively damage cells, allowing us to "interrogate" the mechanical properties of adjacent tissues. By applying biophysical and quantitative reasoning to the results of microbeam surgery on wild-type and mutant embryos, we gain insight into the molecular basis of changes in cell and tissue structure during processes such as morphogenesis and wound healing. Previously, microbeams have been used for a wide variety of applications, including surgery, ablation, chromophore-assisted laser inhibition, and molecular uncaging (e.g., Berns et al., 1991, 1998; Bargmann and Avery, 1995; Lin et al., 1995; Skibbens et al., 1995; Wang and Augustine, 1995; Buchstaller and Jay, 2000; Grill et al., 2003). This article describes the use of ultraviolet (UV) laser microbeam interrogation strategies, combined with confocal microscopy, to investigate the developmental process of dorsal closure (Figs. 1 and 2; see also Kiehart et al., 2000; Harden, 2002; Jacinto et al., 2002; Hutson et al., 2003).
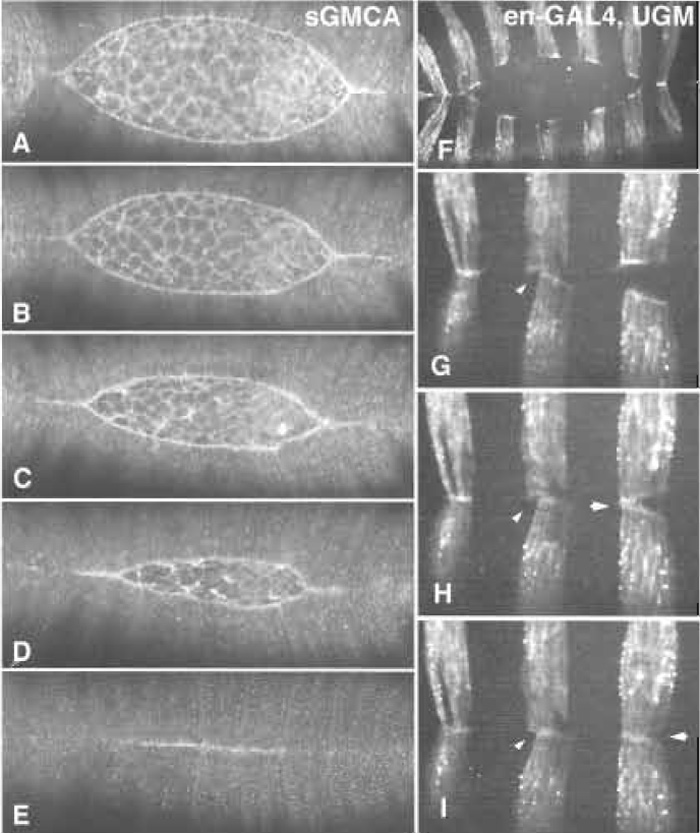 |
| FIGURE 1 Native dorsal closure. (A-E) A time-lapsed sequence of dorsal closure in an embryo that expresses GFPmoe ubiquitously under the control of the heterologous spaghetti-squash (encodes nonmuscle myosin regulatory light chain) promoter/enhancer cassette (from Kiehart et al., 2000). (F-I) A time-lapsed series from an embryo in which the GFPmoe is expressed in epidermal stripes. The yeast transcriptional activator GAL4 was expressed under the control of an engrailed enhancer/promoter cassette, which in turn drives the expression of UAS-GFPmoe (Bloor and Kiehart, 2002). The GAL4/UAS expression system was developed by Brand and Perrimon (1994). |
 |
| FIGURE 2 Confocal fluorescent images of native and laser perturbed dorsal closure. (A) An image of the dorsal opening just prior to laser surgery. (B) The full recoil of the dorsal opening, which occurs 165s after a mechanical jump experiment, i.e., where the laser microbeam cuts from canthus to canthus (along black line in A) to remove the force due to the amnioserosa. Taken from Hutson et al. (2003). |
Drosophila embryos that carry GFP-fusion transgenes are mounted to allow high spatial and temporal resolution imaging under conditions that allow development to proceed unimpeded. We use GFP fused to the actin-binding region of moesin (here called GFPmoe; Edwards et al., 1997; Kiehart et al., 2000; Bloor and Kiehart, 2002; Dutta et al., 2002; Hutson et al., 2003), which functions as a fluorescent marker for Factin- rich regions of cells in the embryos. We can express these GFPmoe transgenes under the control of a variety of different promoter/enhancer cassettes (Fig. 1) and find that they are benign under all conditions examined so far: fly development is completely normal from egg lay to the formation of healthy, fertile adults such that we can maintain homozygous stocks of the fluorescently marked flies. Because of the high concentration of filamentous actin in the cortex of virtually all fly cells, these constructs provide a particularly efficacious way of imaging cell boundaries, thereby revealing the structural complexity of the embryo at the cellular level. Other GFP-fusion constructs (e.g., GFP-α-catenin, GFP-actin, GFP-src, GFP-DE-cadherin, Oda and Tsukita 1999; Verkhusha et al., 1999; Kaltschmidt et al., 2000; Oda and Tsukita, 2001) are applicable to imaging and may even prove superior for certain applications, but the GFPmoe has the advantage of being stable, bright, and benign.
III. EMBRYO OBSERVATION CHAMBER
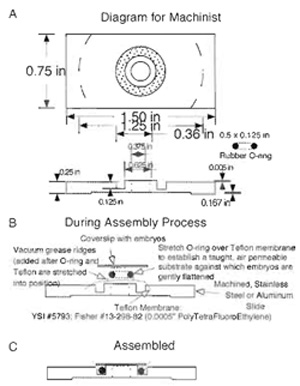
We mount specimens in an environment that does not perturb progress in development (i.e., allows ready access to oxygen, prevents dessication) yet allows for high-resolution imaging (Fig. 3). We sandwich specimens between a gas-permeable membrane (a thin sheet of transparent Teflon that is available commercially and inexpensive, Fisher Scientific, Cat. No. 13- 298-82) and a glass coverslip (Kiehart et al., 1994). The most recent version of our chamber allows the embryo, surrounded by inert, nontoxic halocarbon oil, to be gently and slightly flattened, thereby improving our ability to image movements in a single (or relatively few) optical sections. These slightly flattened embryos hatch into larvae and, if removed from the halocarbon oil, proceed through development to form healthy and fertile flies.
IV. CONFOCAL MICROSCOPY
We perform laser surgery using one of three commercially available confocal microscope systems in which visible [e.g., continuous wave (CW) argon ion, krypton-argon ion, HeCd], lasers excite GFP (or its spectral variants, e.g., Heim and Tsien, 1996; Ormo et al., 1996; Miyawaki et al., 1997) and provide imaging contrast. We have mounted the surgical UV lasers on both upright and inverted microscope systems. Thus far we have used a Zeiss Axioscope (upright) microscope equipped with a Bio-Rad 600 scanning laser confocal imaging system (Kiehart et al., 2000), a Zeiss Axiovert (inverted) outfitted with a Zeiss 410 scanning laser confocal imaging system (Hutson et al., 2003), and a Zeiss Axioplan (upright) outfitted with a Perkin Elmer/Yokogawa spinning disk confocal imaging system using a Hamamatsu Orca ER camera (unpublished). Confocal microscopy is essential for imaging the thick (150µm diameter; 450µm long), optically challenging (yolky and light scattering) embryos.
For the Zeiss Axioscope/Bio-rad 600 system and the Zeiss Axioplan/spinning disk system, which are both upright microscopes, the imaging systems are introduced from above, through the trinocular heads. As a consequence, on these systems we required a long-pass dichroic filter that transmits the 488-nm excitation light and the 508-nm light emitted from EGFP and reflects the 337.1- or 355-nm ablating wavelengths (Model 400DCLP, Chroma Technology Corp., Rockingham, VT). On the Axioscope/Bio-rad system, the UV laser was introduced through the epiport (the mercury arc illuminator and associated collectors and diaphragms used conventionally for wide-field fluorescence work having been removed) so that the unmodified 337.1-nm surgical laser beam illuminated first the dichroic and then the objective, in that order. Unfortunately, the epiport on the Zeiss Axioplan includes a "drop-down" prism that does not transmit or transmits only poorly in the UV so we had to devise an alternate strategy for introducing the ablating beam. We modified an epifilter holder to accept light orthogonal to the nominal axis of incidence by drilling out the end of an epi slider and rotating the dichroic filter holder about the optic axis so that it remains positioned at 45° to the optic axis, but can reflect the UV light passing through the end of the slider onto the optic axis (Fig. 4). Most competent university machine shops should be able to modify an existing Zeiss slider in this manner satisfactorily. More recent Zeiss microscopes do not have this transmission problem, so that the standard epiport can be used to introduce the ablating beammone of the fluorescent filter sets is simply replaced with the appropriate dichroic filter.
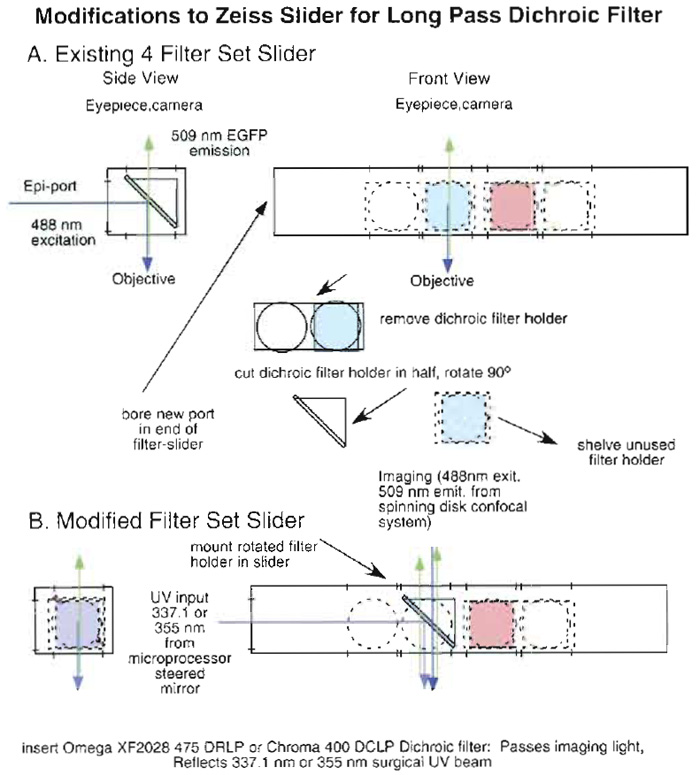 |
| FIGURE 4 Modifications required so that a Zeiss epifluorescent filter holder/slider can be used to introduce UV ablating light onto the optic axis of a Zeiss Axioplan microscope (see text). (A) A schematic of the unmodified four-position slider with filter sets. It diagrams removal and modification of one of the dichroic filter mounts. (B) A schematic of the modified holder with the appropriate dichroic mounted. UV ablating light enters through a hole bored in the end of the slider. |
Originally, we used a nitrogen laser to produce a UV beam on the Zeiss Axioscope/Bio-rad 600 imaging system that, as implemented, can be described more appropriately as a "UV macrobeam" (see later). The N2 laser (Model VSL-337ND-S, 337.1nm, 300µJ, 75-kW ~peak power, 4-ns pulse width, 0-60 Hz repetition rate, Laser Science, Inc., Franklin, MA) was introduced without modification through the wide-field epiport of our microscope as described earlier. The beam produced by this laser does not have a Gaussian spatial profile nor did it fill the back aperture of the 25x (NA 0.8) or 40x (NA 0.9, 1.0, 1.2, or 1.3) objectives commonly used for our experiments. As a consequence, lesions that result are larger than 5-10 ~tm in diameter. Furthermore, the N2 laser is an unstable resonator. Consequently, introduction of a spatial filter designed to produce a Gaussian spatial profile proved impractical due to damage to the spatial filter and insufficient transmitted intensity for microsurgery. Nevertheless, the original system provided a useful tool for introducing spot lesions and did yield biologically significant observations (Kiehart et al., 2000). Fiber adapters that couple this N2 laser to various microscope systems are available commercially through Laser Science, Inc. However, we have found that the flexibility offered by individual optical components offsets the disadvantage of the extra space they require. Thus, we chose an alternate strategy to improve the quality of our microbeam.
To produce a near diffraction-limited spot, the laser beam is steered into the optical path of the microscope using an "optical train" that consists of individual components (mirrors, lenses, filters, and diaphragms) mounted on an vibration isolation table (e.g., Micro-G, Technical Manufacturing Corp., Peabody, MA). By implementing a beam expander, the back aperture of the objective can be filled and a near diffractionlimited microbeam generated so that the area of a lesion can be reduced to the submicrometer scale, achieving our goal of ablating a single cell (Figs. 5 and 6).
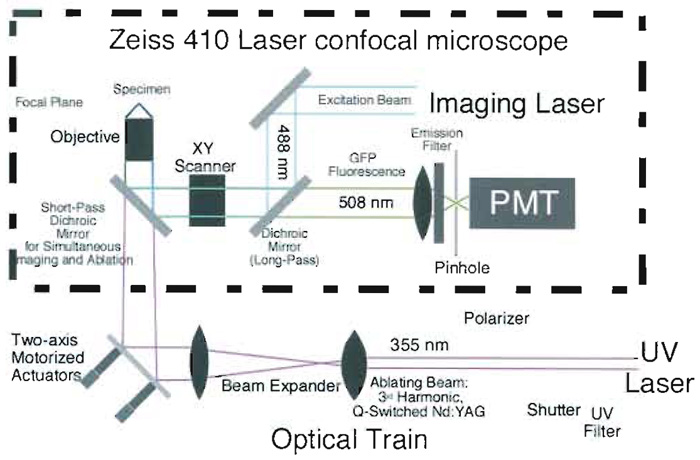 |
| FIGURE 5 Schematic diagram of the Zeiss 410 scanning laser confocal microscope/UV laser surgical system. Part of the interior of the microscope (dotted box) showing how the internal excitation beam (visible argon ion laser) and the external microbeam (third harmonic of a Nd:YAG laser) are combined by a shortpass dichroic mirror to simultaneously direct both laser beams onto the sample. In order that the visible and UV focal planes coincide, the microbeam converges slightly in this case to compensate for the chromatic aberration of the microscope objective (see text). The long-pass dichroic mirror shown is an integral part of the Zeiss 410 imaging system and is left unmodified. It reflects excitation light scattered from the specimen while transmitting fluorescent light to the pinhole and onto the photomultiplier tube (PMT). Note that our laser confocal system utilizes an inverted microscope, with the specimen set above the objective. A comparable system, mounted on a standard upright microscope, is very similar and is described in the text |
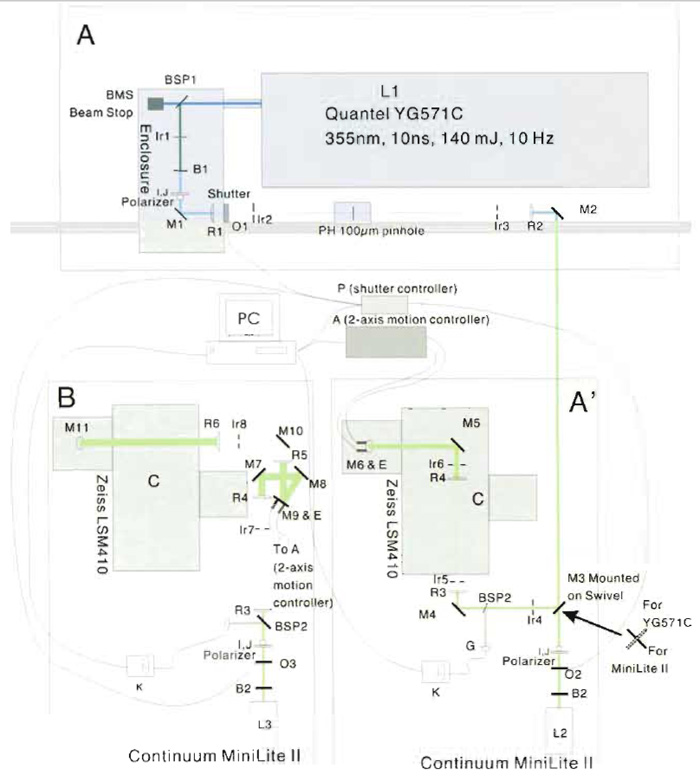 |
| FIGURE 6 Optical layout for the UV microbeam, scanning laser confocal microscope system. Sketch of the optical train of the UV ablating laser system mounted on the Zeiss 410 imaging system is drawn roughly to scale. (A and A') Layout for Quantel and Minilite II. (B) Layout for Minilite II with telescope included. Major components are labeled and letters are described in Table I and in the text. |
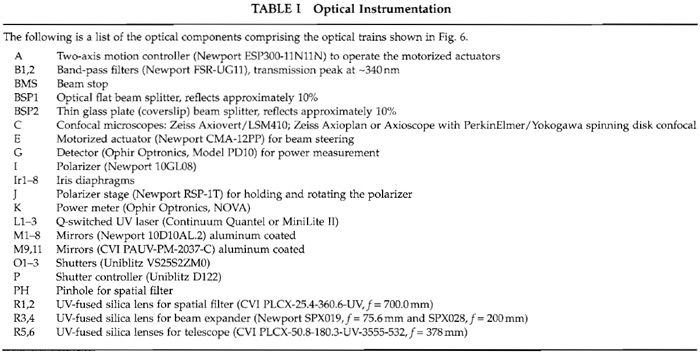
The optical train required to achieve a near diffraction- limited spot in the specimen plane is shown schematically and approximately to scale for the two generations of Continuum Nd:YAG lasers that we used (Fig. 6). The individual components are described later, their position is specified by an appropriate letter in Fig. 6, and the suppliers and part numbers for the various components are specified in Table I. The specific components were chosen based on a number of factors, including compatibility with other components, cost, and availability. In most if not all cases, equivalent lenses, mirrors, and filters and ancillary components such as rails, sliders, posts, lens, and mirror mounts are available from any one of a number of suppliers (e.g., Melles Griot, www.mellesgriot.com; Oriel, www.oriel.com, Newport, www.newport.com; Edmund Industrial Optics, www.edmundoptics.com; CVI Laser, www.cvilaser.com; Chroma, www.chroma. com; and Omega, www.omegafilters.com). Lenses and mirrors were mounted in appropriate mounts and positioned via posts, sliders, and optical rails as shown schematically.
 |
Downstream of the laser and upstream of the beam expander are the following key components: A UV band-pass filter (B1 and B2 in Fig. 6, peak transmission at 340 or 355 nm) is positioned at the exit of the laser and transmits only the third harmonic (355 nm) while blocking the fundamental and second harmonic. To control sample exposure to the microbeam, a shutter (O1-3) and a calcite polarizer (I) mounted on a rotary stage (J) are situated after the UV band-pass filter. The shutter is operated by a shutter controller (P) connected to the same computer that steers the beam (see later) via an RS-232 interface. Note that this computer is distinct from the imaging PC required for either laser scanning or spinning disk confocal imaging of the samples. Control of the shutter is achieved through custom plug-ins written for ImageJ, a free software package available from the Web site of the National Institutes of Health (NIH), http://rsb.info.nih.gov/ij/. The custom plug-ins that we have written are available on our Web site: http://www.biology.duke.edu/kiehartlab/biopdc/.
VII. FINE.TUNING THE OPTICAL TRAIN TO OPTIMIZE THE MICROBEAM
Minimization of the microbeam spot size at the imaging focal plane is achieved by optimizing two beam parameters: beam diameter and divergence. Our first problem is that the diameter of the emitted laser beam (<3mm) is considerably smaller than the back aperture (~10mm) of the objective lenses typically used for imaging and surgery. A second complication arises because the index of refraction of the lenses in the objective is wavelength dependent. Although the objectives used are neofluars (fluorite lenses sometimes called semiapochromats; Inoue and Spring, 1997; Murphy, 2001) or apochromats in the visible spectral region, the index of refraction varies with wavelength in the UV. The resulting longitudinal chromatic aberration causes a discrepancy in the position along the optical axis between the focal points of the visible light and the UV light.
In practice, to optimize alignment of the beam expander, we made test samples constisting of a thin layer (~150µm thick) of 1-2% agarose (in deionized water) sandwiched between a slide and a coverslip. For visible light the agarose was supplemented with 0.2% rhodamine dye, for UV light no dye was used. In each case, the focused beam cavitates the gel in a small region defined by the focus, causing a small bubble to form. Fine adjustment of the two beam expander lenses is performed by iteratively reducing the power such that it is just sufficient to cavitate the gel and then readjusting the lenses such that the focal planes of the visible, imaging light and the UV ablating light coincide. The process is repeated until minimum power is required to ablate the gel adjacent to the coverslip. Near diffraction-limited spot size is confirmed by using the laser to ablate holes in a thin film of aluminum evaporated onto glass, which forms an ideal and stable test specimen (Fig. 7A).
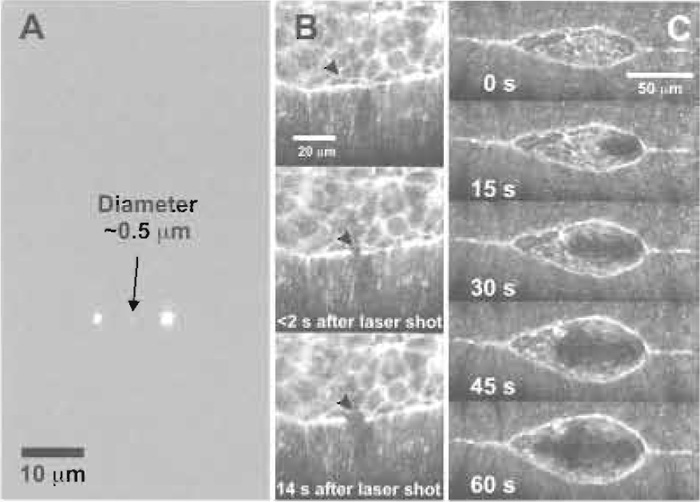 |
| FIGURE 7 Performance of the UV microbeam. (A) Demonstration of the near diffraction-limited spot size as measured on a thin film of aluminum. The smallest spot was made by a single pulse of ~50nJ on the film. The left and the right incisions received single pulses of ~100 and ~200nJ, respectively. (B) Application of the near diffraction-limited microbeam to surgery on the leading edge of the lateral epidermis. The microbeam was aimed at the center of the field, a specimen was brought into position, and the supracellular purse string at the leading edge was nicked by a single pulse of ~200nJ. (C) Demonstration of beam steering: the microbeam is steered from canthus to canthus to make a linear incision. Elapsed time is shown in seconds and starts at first lasing. Reproduced from Edwards et al. (2003). |
VIII. BEAM STEERING
By introducing two computer-controlled linear actuators (E's in Fig. 6) to angularly position one of the mirrors in the optical path, the beam can be steered systematically in two dimensions, thus converting a spot ablation tool into a precise UV-scalpel for tissue surgery (see results: Figs. 2 and 7). The actuators replace adjustment screws of a kinematic optical mount. The two motorized actuators are positioned by a two-axis motion controller (A in Fig. 6), which offers a step size of 0.1 µm. With this step size, the resolution of the laser trajectory is not limiting and is instead determined by the coarseness of the image, i.e., the number of pixels in a frame (512 x 512). With the 40x objective that we typically use, we achieve subcellular resolution in the specimen. The controller communicates via an RS-232 interface with the microbeam computer running ImageJ with custom Java plug-ins. The plug-ins allow PC-controlled steering of the microbeam at a constant velocity along any defined trajectory in the specimen plane.
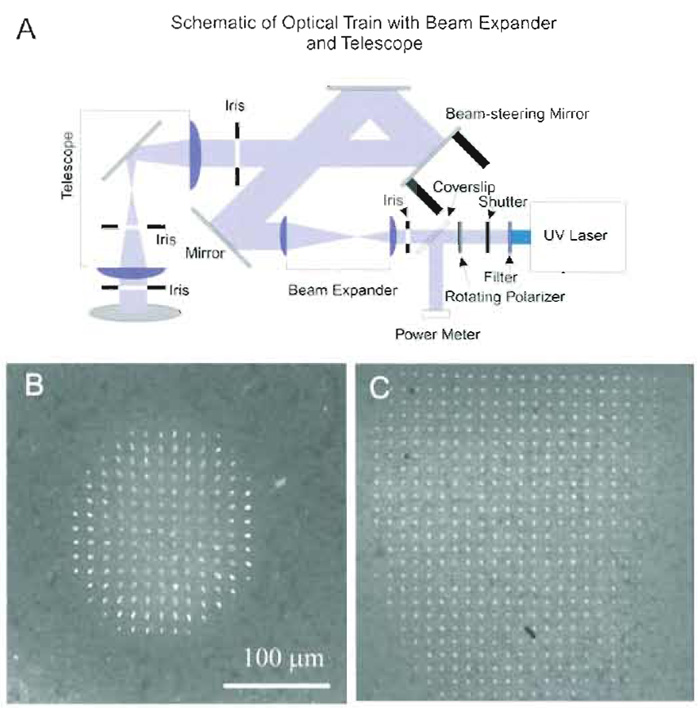 |
| FIGURE 8 An optical telescope improves the effective area of laser ablation. (A) UV optical train using a telescope to avoid vignetting at the back aperture of the objective (see text). (B) Effective area of laser ablation without the telescope is limited due to clipping of the UV microbeam using the UV optical train shown in Fig. 5. Only the region within the circle of radius ~70µm about the optical axis can be ablated on a target specimen (rhodamine dye in agarose gel). (C) Effective area of UV laser ablation after installation of the telescope. Note that the area is expanded significantly, covering the major part of the image plane, and that the lesions maintain a round morphology farther from the optical axis. Scale bar is for both B and C. |
IX. AUTOMATED ACQUISITION OF GEOMETRIC PARAMETERS
High-resolution time-lapsed analysis of morphogenesis can rapidly generate vast quantities of images that can quickly overwhelm the researcher's ability to store and interpret data. In particular, data analysis that requires manual intervention becomes a critical rate-limiting step. As a consequence, we apply automated methods designed to extract a small number of key geometric parameters from stacks of several hundred images, each 2-4 Mbytes in size. First, confocal images of dorsal closure are saved as TIFF files directly or are exported from proprietary software into TIFF or AVI format. Such images are then loaded into the ImageJ image processing software. Several basic processing functions, such as measurement of the length or the area of a designated region, are built into the software, but additional customized routines have been implemented as custom Java plug-ins.
Thus far, we have been most successful with automated methods designed to recover the shape of the exposed amnioserosa, as outlined by the bright, actinrich, supracellular purse string that forms at the leading edge of the lateral epidermis (Figs. 1, 7, and 9). To quantify how the tissue geometry changes with time in native embryos or in those cut with the UV laser microbeam, we extract the contour of the leading edge in each image as digitized information as follows: in our system, the original size of an image is typically 512 x 512 pixels, but can be as large as 2048 x 2048 pixels. To optimize handling of the large data sets, the first image is cropped to reduce its size so that it contains only the region of interest (typically the entire embryo). By treating the set of TIFF images as a stack, all of the following images are automatically cropped using the same frame. To capture the contour of the leading edge, which is represented as bright pixels forming a closed geometry, we employ the technique of active contour models, also known as "snakes" (Kass et al., 1987). This method is generally used for recognizing the boundary of an object in an image and, in our images, readily identifies the supracellular purse string or actin-rich cable at the leading edge as the bright pixels due to GFPmoe fluorescence (Fig. 9). In practice, each stack of images is processed with a custom Java plug-in that executes the snakes analysis.
| Etotal = Einternal + Eimage + Econstraint | (1) |
where Einternal and Eimage are integrals of (a | dv/ds |2 + b | d2v/ds2 |) and c I(s), respectively. The parameter s runs from 0 to 1 and v is a vector in the x, y plane as shown in Fig. 9. The parameters a, b, and c weight the contributions from the terms to achieve acceptable curve fitting and are chosen by user intervention. The first term of Einternal, a | dv/ds |2, is analogous to the energy due to stretching of an elastic rod. Note that the 100 points are approximately distributed uniformly along the leading edge, as if "springs" that connect these points are of nearly uniform, minimal length (Fig. 9). The second term of Einternal, b | d2v/ds2 | , is analogous to the bending energy of a rod and here is minimized as well: as a consequence, steep bends are energetically expensive and selected against in the energy minimization process. The image energy Eimage e is the value of the experimentally determined inverse intensity, described previously. The final energy term, Econstraint, addresses the complications of fitting the leading edges where they converge near the canthi and beyond where they are already sutured into seams. In our implementation, these constraints mimic the connection of two additional springs. One spring connects the 1st snake point to the right edge of the image; the second connects the middle (50th) snake point to the left edge. Mathematically, Econstraint is given by k(x1- w)2 + kx502, where w is the width of the cropped image. Similar to a, b, and c, the parameter k is chosen by user intervention to achieve acceptable curve fitting.
Preparation of the Embryos for Observation
Small population cages containing 30-300 adult flies of the appropriate genotype are used to collect embryos on grape juice agar plates by standard methods (Roberts, 1998). To improve the optical qualities of the embryo, the chorion is removed mechanically by rolling an embryo on double-sided adhesive tape or is removed chemically by immersing the embryo in 50% bleach using standard methods (Roberts, 1998). This leaves behind a transparent protective layer, the vitelline envelope. With the aid of a dissecting microscope, the dechorionated embryos are oriented dorsal side up in an orthogonal array (e.g., three rows of 10 embryos each) on a pad of 1% agar. The embryos are spaced so that they are at least 1-2 embryo diameters apart. The array is then picked up on a #1.5 22 x 22-mm glass coverslip coated with a thin layer of "embryo glue" (Roberts, 1998). We find that arranging the embryos on the agar pad allows more flexibility in getting their orientation just right and dramatically reduces the number of embryos that are damaged when compared to protocols that call for aligning the embryos directly on the glue-coated coverslip. The coverslips are made in advance by putting a few drops of adhesive, solubilized from double-stick tape (type 415, 3M Company, St. Paul, MN; Whiteley and Kassis 1993) with hexane and allowing the glue to air dry for at least 5-10 minutes (we typically store the coated coverslips in a closed box to avoid accumulation of dust and use them within 1-2 days of coating them). To prevent desiccation, the embryos are covered immediately with a few drops of halocarbon oil (#27 or #700, or a mixture of the two, Sigma, St. Louis, MO), which is chemically inert and allows ready access to O2.
Note that it is important to wear appropriate protective eyewear when working with the pulsed UV laser beam. Although we typically use the UV laser in its low-energy mode, the pulses still contain significant intensity, especially before they reach the calcite polarizer. Keep in mind that this polarizer attenuates the beam via reflection. To eliminate a potentially dangerous reflection, we cover the reflection ports of the polarizer housing with opaque electrical tape. The Continuum Minilite II is a class IV laser and special precautions and training are appropriate for personnel involved in setting up the microbeam system (Marshall and Sliney, 2000; Sliney, 2000). In practice, the UV ablating beam is attenuated by glass elements throughout the optical path of the microscope system; nevertheless, we never observe the specimen through the microscope eyepieces while it is being illuminated by the UV laser. A visible microbeam would be a significant eye hazard and safety interlocks are required.
XII. MICROBEAM OPTIMIZATION
A. Daily Protocol
To optimize the system and dissect the surface of an embryo effectively, we describe general procedures that should typically be performed daily before laser surgery on embryos is attempted. However, if the laser exhibits a Gaussian spatial profile and is stable, several steps (2, 3, 4, and 10) can be skipped. Note that the third harmonic generated by the laser is polarized horizontally and rotating the polarizer set in the optical train attenuates the power as a function of the angle Ψ between the beam's polarization and the crystal polarization (~cos2Ψ).
- Turn on the microscope, the imaging system including the imaging laser, and the computer. Turn on the ablating laser and its computer. Verify that the ablating shutter is in the closed position and that the ablating laser is in the low-energy mode. Allow all systems to warm up for several minutes.
- To estimate the intensity of the laser and evaluate the dose delivered to the specimen plane, deflect a small fraction of the energy to a power meter (Model PD10, Ophir Optronics, Wilmington, MA) with a partially reflecting surface (a coverslip) placed in the optical train (BSP2 in Fig. 6). The steps that follow calibrate the optical train by comparing the power of the deflected light to the power measured at the specimen plane. If two calibrated detectors are available, measurements can be taken simultaneously: one detector is positioned to measure the deflected light and the other is positioned on the microscope stage (it replaces the specimen) at or near the focal point of the objective. If only one detector is available, power at the two positions is measured sequentially (we find that in practice the output from the Continuum Minilite II is very stable and that this approach is quite satisfactory).
- Open the UV laser shutter and read the energy per pulse at each detector. Because the amount of energy deflected to the power meter by reflection from the coverslip is a function of the angle of incidence and the azimuth angle of the polarized 355-nm ablating light, the ratio of these readings shows slight dependence on the angle of the calcite polarizer. Check and record the ratios for several angles. Later, during embryo surgery, observe the angle of the polarizer and use the appropriate ratio to estimate the energy incident on the sample.
- Close the UV laser shutter.
- Remove the detector at the specimen plane and place a slide of an agarose gel made by sandwiching a drop of molten agarose or agar (1-2% in deionized H2O containing 0.02% NaN3 as a preservative and, for use in fluorescent mode, 0.02% rhodamine B or fluorescein) between a slide and a coverslip and sealing the coverslip (nail polish is convenientmthis preparation lasts indefinitely). To aid in determining the plane of focus during subsequent steps, we first make fine scratches on the inside surface of the coverslip with a diamond-tipped marker prior to assembling the agar sandwich. We adjust the thickness of the agarose so that it is approximately 150 µm, thereby simulating the optical properties of an embryo sample chamber. For our applications, laser surgery typically occurs close to the surface of the embryo, <15 µm deep.
- Block the UV laser beam from entering the microscope with a beam stop (not shown in Fig. 6) positioned somewhere after the coverslip beam splitter (BSP2 in Fig. 6) and then open the UV laser shutter. A small fraction of the beam will be reflected by the coverslip beam splitter (BSP2) to illuminate the detector G. Rotate the polarizer until the estimated value of the energy per pulse that would reach the sample when the beam stop is removed reaches the threshold required to cavitate the gelmfor our system, this threshold, using either a 40x, 1.3NA oil immersion lens or a 40x, 1.2NA water immersion lens, is ~200nJ/pulse. The angle of the polarizer and the ratio of intensities at detector G and at the specimen position for this particular angle, previously measured in step 3, are used to estimate the energy at the sample.
- Close the UV laser shutter and remove the beam stop.
- While monitoring the surface of the gel on the monitor screen of the confocal system using transmitted light mode, use the shutter to let a single laser pulse illuminate the gel. This procedure is repeated in steps 9 and 10.
- Adjust the orientation of the mirror using the two-axis motion controller so that the ablation beam hits the center of the gel on the screen. Specifically, record the x, y position of the ablated spot, execute the "Center_Microbeam" custom ImageJ plug-in to recalibrate the beam steering computer's coordinate system, and set the position of the spot to the origin at the center of the imaging field.
- Optimize the position of the two lenses in the beam expander by adjusting them so that diameter of the ablated spot is minimal. Two factors-the distance between the two lenses and between the objective and the second lens-determine the size of the lesion produced by the laser beam. For the objectives we have used, the smallest possible lesion is achieved with a slightly converging beam. Initially, align the beam expander to transmit plane parallel light and set the laser power so that a single pulse is more than sufficient to ablate a spot in the gel at the focal plane. Next, carry out an iterative process whereby the distance between the two lenses of the beam expander is increased, typically in several millimeter steps, to introduce a convergence to the transmitted light. In practice, the lens closest to the back aperture of the objective remained fixed and we moved the first lens to increase the distance between the lenses, a few millimeters at a time. This initially reduces and then expands the UV spot size in the focal plane. As a consequence, the adjustment moves the lenses through the optimal convergence-once that occurs, reduce the increment and step back to the point that gives the apparent minimum spot size. Reduce the energy per pulse and then repeat the protocol just described to fine-tune the beam expander. Typically three to five iterations are sufficient to minimize the spot size. Measured on the agarose gel, the lesion diameter is typically 1-3 µm.
- Once the microbeam alignment has been completed, the near diffraction-limited spot size is confirmed by replacing the gel sample with a thin aluminum film. By rotating the polarizer to attain the minimum exposure that ablates with a single shot, the lesion radius approaches the diffraction limit.
D. Dissection and Imaging of the Embryo
- Replace the aluminum film with an observation slide of appropriately staged Drosophila embryos. Set the laser power to below that which is expected to be a threshold dose for creating a lesion (e.g., 200nJ per pulse) and use a target embryo to empirically define the power required to generate a lesion of desired magnitude by gradually increasing the dose until the appropriate response is seen in the confocal image of the embryo. Once a desired dose has been defined, verify this on a different region of the same target embryo or on a new embryo. Then, select a new specimen, record an image, and transfer the image from the imaging computer to the beam steering computer. Using the beam steering computer, specify the pattern you wish to cut on the embryo.
- On the imaging computer, initiate a time-lapsed series. Verify that the intensity in the image does not exceed the dynamic range of the digital acquisition system. With collection of the confocal time-lapse series underway, use the beam steering computer to initiate the laser surgical cut(s). Process and analyze images later.
When choosing mirrors, one should consider their damage threshold and the reflection coefficient at the appropriate laser wavelength. Broadband aluminumcoated mirrors have been selected for all mirrors in the optical train.
For UV-transmitting lenses, those made of UV-fused silica have excellent transmission from 180nm up to 2100nm at moderate cost. To allow flexibility in choosing the wavelength of the beam, lenses without optical coating may be preferable.
Generally, the transmission of standard microscope objectives shows a steep drop off in the UV. If UV lasers with shorter wavelengths are selected, make sure that the objective is designed for this range and that the energy of the beam after transmission through the objective lens is sufficient for incisions. In particular, avoid laser damage to the objective itself due to UV absorption.
XIV. CLOSING REMARKS
Laser microbeams have become an essential tool to investigate dynamics in cell biology. We have presented details of our specific application to microsurgery using computer steering of near diffraction-limited UV beams. We have applied this approach, together with mathematical modeling and biophysical reasoning, to probe the forces responsible for morphogenesis in Drosophila, where the wide array of mutations that affect such processes allow us to investigate the molecular bases for such forces (Hutson et al., 2003; unpublished observations). We are extending our studies to other morphogenetic movements in Drosophila (e.g., thoracic closure) and are exploring the use of these approaches in other model species- Caenorhabditis elegans (nematode), Danio rerio (zebrafish), and Mus musculus (mouse). As described in the introduction, microbeams, particularly computer-steered microbeams, might also be applied to other approaches that use optical methods to probe molecular function, e.g., fluorescent resonance energy transfer, fluorescence recovery after photobleaching, or chromophore-assisted laser inactivation.
Bargmann, C. I., and Avery, L. (1995). Laser killing of cells in Caenorhabditis elegans. Methods Cell Biol. 48, 225-250.
Berns, M. W., Tadir, Y., Liang, H., and Tromberg, B. (1998). Laser scissors and tweezers. Methods Cell Biol. 55, 71-98.
Berns, M. W., Wright, W. H., and Wiegand Steubing, R. (1991). Laser microbeam as a tool in cell biology. Int. Rev. Cytol. 129, 1-44.
Bloor, J. W., and Kiehart, D. P. (2002). Drosophila RhoA regulates the cytoskeleton and cell-cell adhesion in the developing epidermis. Development 129, 3173-3183.
Brand, A. H., Manoukian, A. S., and Perrimon, N. (1994). Ectopic expression in Drosophila. In "Drosophila melanogaster: Practical Uses in Cell and Molecular Biology." (L. S. B. Goldstein, E. A. Fyrberg, eds.), pp. 635-654. Academic Press, San Diego.
Buchstaller, A., and Jay, D. G. (2000). Micro-scale chromophoreassisted laser inactivation of nerve growth cone proteins. Microsc. Res. Tech. 48, 97-106.
Dutta, D., Bloor, J. W., Ruiz-Gomez, M., VijayRaghavan, K., and Kiehart, D. P. (2002). Real-time imaging of morphogenetic movements in Drosophila using Gal4-UAS-driven expression of GFP fused to the actin-binding domain of moesin. Genesis 34, 146-151.
Edwards, K. A., Demsky, M., Montague, R. A., Weymouth, N., and Kiehart, D. P. (1997). GFP-moesin illuminates actin cytoskeleton dynamics in living tissue and demonstrates cell shape changes during morphogenesis in Drosophila. Dev. Biol. 191, 103-117.
Foe, V. E. (1989). Mitotic domains reveal early commitment of cells in Drosophila embryos. Development 107, 1-22.
Grill, S. W., Howard, J., Schaffer, E., Stelzer, E. H., and Hyman, A. A., (2003). The distribution of active force generators controls mitotic spindle position. Science 301, 518-521.
Harden, N. (2002). Signaling pathways directing the movement and fusion of epithelial sheets: Lessons from dorsal closure in Drosophila. Differentiation 70, 181-203.
Heim, R., and Tsien, R. Y. (1996). Engineering green fluorescent protein for improved brightness, longer wavelengths and fluorescence resonance energy transfer. Curr. Biol. 6, 178-182.
Inoue, S., and Spring, K. R. (1997). "Video Microscopy." Plenum Press, New York.
Jacinto, A., Wood, W., Balayo, T., Turmaine, M., Martinez-Arias, A., and Martin, P. (2000). Dynamic actin-based epithelial adhesion and cell matching during Drosophila dorsal closure. Curr. Biol. 10, 1420-1426.
Jacinto, A., Woolner, S., and Martin, P. (2002). Dynamic analysis of dorsal closure in Drosophila: From genetics to cell biology. Dev. Cell 3, 9-19.
Kaltschmidt, J. A., Davidson, C. M., Brown, N. H., and Brand, A. H. (2000). Rotation and asymmetry of the mitotic spindle direct asymmetric cell division in the developing central nervous system. Nature Cell Biol. 2, 7-12.
Kass, M., Witkin, D., and Terzopoulos, D. (1987). Active contour models. Int. J. Comput Vision 1.
Kiehart, D., Galbraith, C., Edwards, K., Rickoll, W., and Montague, R. (2000). Multiple forces contribute to cell sheet morphogenesis for dorsal closure in Drosophila. J. Cell Biol. 149, 471-490.
Kiehart, D. P., Montague, R. A., Rickoll, W. L., Foard, D., and Thomas, G. H. (1994). High-resolution microscopic methods for the analysis of cellular movements in Drosophila embryos. Methods Cell Biol. 44, 507-532.
Lin, D. M., Auld, V. J., and Goodman, C. S. (1995). Targeted neuronal cell ablation in the Drosophila embryo: Pathfinding follower growth cones in the absence of pioneers. Neuron 14, 707-715.
Lippincott-Schwartz, J., and Patterson, G. H. (2003). Development and use of fluorescent protein markers in living cells. Science 300, 87-91.
Marshall, W., and Sliney, D. (eds.) (2000). "Laser Safety Guide." Orlando, FL.
Miyawaki, A., Llopis, J., Heim, R., McCaffery, J. M., Adams, J. A., Ikura, M., and Tsien, R. Y. (1997). Fluorescent indicators for Ca2+ based on green fluorescent proteins and calmodulin. Nature 388, 882-887.
Murphy, D. B. (2001). "Fundamentals of Light Microscopy and Electronic Imaging," Wiley-Liss, New York.
Oda, H., and Tsukita, S. (1999). Dynamic features of adherens junctions during Drosophila embryonic epithelial morphogenesis revealed by a Dalpha-catenin-GFP fusion protein. Dev. Genes Evol. 209, 218-225.
Oda, H., and Tsukita, S. (2001). Real-time imaging of cell-cell adherens junctions reveals that Drosophila mesoderm invagination begins with two phases of apical constriction of cells. J. Cell Sci. 114, 493-501.
Roberts, D. B. (1998). "Drosophila: A Practical Approach." IRL Press at Oxford University Press, New York.
Skibbens, R. V., Rieder, C. L., and Salmon, E. D. (1995). Kinetochore motility after severing between sister centromeres using laser microsurgery: Evidence that kinetochore directional instability and position is regulated by tension. J. Cell Sci. 108(Pt 7), 2537-2548.
Sliney, D. (ed.) (2000). LIA Guide for the Selection of Laser Eye Protection. Orlando, FL.
Stronach, B. E., and Perrimon, N. (2001). Investigation of leading edge formation at the interface of amnioserosa and dorsal ectoderm in the Drosophila embryo. Development 128, 2905-2913.
Verkhusha, V. V., Tsukita, S., and Oda, H. (1999). Actin dynamics in lamellipodia of migrating border cells in the Drosophila ovary revealed by a GFP-actin fusion protein. FEBS Lett. 445, 395- 401.
Wang, S. S., and Augustine, G. J. (1995). Confocal imaging and local photolysis of caged compounds: Dual probes of synaptic function. Neuron 15, 755-760.
Whiteley, M., and Kassis, J. A. (1993). Double-sided sticky tape for embryo injections. Drosophila Information Newsletter 11: http://flybase.bio.indiana.edu/docs/news/DIN/dinvo111.txt.
Wood, W., Jacinto, A., Grose, R., Woolner, S., Gale, J., Wilson, C., and Martin, P. (2002). Wound healing recapitulates morphogenesis in Drosophila embryos. Nature Celt Biol. 4, 907-912.
Young, P. E., Richman, A. M., Ketchum, A. S., and Kiehart, D. P. (1993). Morphogenesis in Drosophila requires nonmuscle myosin heavy chain function. Genes and Dev. 7, 29-41.
