The inheritance due to multiple factors or polygenes will be illustrated in this section with the help of three examples : (i) kernel colour in wheat (studied by
H. Nilsson-Ehle). (ii) skin colour in Humans (studied by
C.B. Davenport) and (iii) corolla length in
Nicotiana longiflora (studied by E.M. East).
Kernel colour in wheat
Kernel colour in wheat is a quantitative character and was studied by
H. Nilsson-Ehle for the first time in 1908. It was argued that if one gene was considered or in other words, if the two parents differed due to one gene only, a 3 : 1 ratio for red and white kernels was obtained in F
2 generation. However, out of three red, one was as red as one of the parents and two were lighter and were comparable to F
1 individuals. This indicated that the dominant alleles had a cumulative effect. If 'K' stands for red colour and V for white, the two parents could be designated as
RR and
rr, the F
1 could be designated as
Rr and F
2 would be obtained in 1
RR : 2
Rr : 1
rr ratio. In these three classes,
RR should be red,
Rr should be intermediate in colour and
rr should be white.
In case there were two genes involved, a 15 : 1 ratio (15 coloured : 1 white) would be obtained (Table 4.1). If different shades are taken into account, 1:4:6:4:1 ratio will be obtained, provided
Rx and
R2 contribute equally to the colour (Fig. 4.1). However, it is known now thatthere are three genes involved in kernel colour in wheat. Obviously if the two parents differ in all three genes, in F
2 63 : 1 or 1 : 6 : 15 : 20 : 15 : 6 : 1 ratio will be obtained (Fig. 4.2). By the study of kernel colour in wheat,
Nilsson-Ehle reached the conclusion that the effect of each dominant allele was cumulative and hence forwarded his multiple factor hypothesis. The hypothesis states that for a given quantitative trait there could be several genes, which were independent in their segregation, but had cumulative effect on. phenotype.
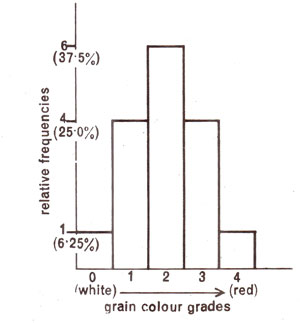
Fig. 4.1. Relative frequencies (theoretical) of different grain colours in wheat in F2 population derived from two strains differing in two gene pairs.
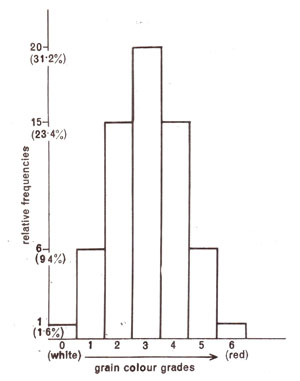
Fig. 4.2. Relative frequencies (theoretical) of different grain colours in wheat in F2 population derived from two strains differing in three gene pairs.
Skin colour in human beings C.B. Davenport in 1913 reported results of studies regarding the inheritance of skin colour in negro and white populations in United States of America. In U.S.A. the populations derived from marriages between negro and white individuals are known as
mulattoes. The offsprings from negro-white marriages give intermediate skin colour in the first generation. When such individuals intermarry among themselves, all shades of skin colour are obtained. If twp loci
A and
B are responsible for the skin colour, African-Americans can be represented by the genotype
AABB and whites as
aabb. Mulattoes will be
AaBb with intermediate skin colour. The pattern of segregation in F
2 is shown in Figure 4.3.
Subsequently, it could be shown that skin colour in humans can not be sharply placed in five categories. Although, this absence of sharp categories may sometimes be due to environmental effect, it was later shown that for skin colour more than two gene pairs may be involved. Expected distributions were derived assuming involvement of 2, 4, 6 and 20 gene pairs and taking 70% and 30% as gene frequencies for colour genes and their recessive alleles. These theoretical distributions when compared with observed results, it could be shown that at least four or five gene pairs may actually be involved in the control of skin colour (Fig. 4.4). This may be further modified due to some modifying genes commonly associated with quantitative traits.
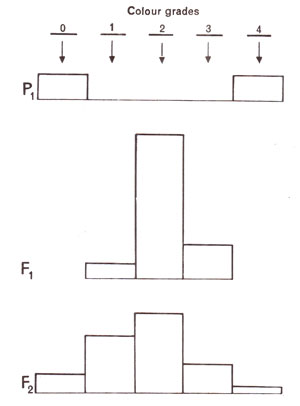
Fig. 4.3. Distribution of skin colours in human beings in parents (white with 0 and African-Americans with 4), F1 and F2 generations (drawn from original data of Davenport).
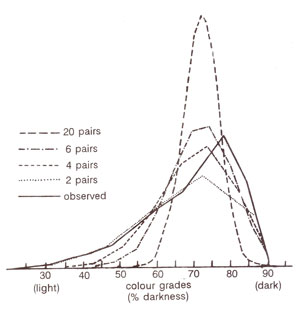
Fig. 4.4. Frequencies of individuals with different degrees of skin colour among African-Americans in U.S.A. Observed frequencies are compared with theoretical frequencies for different numbers of independently segregating additive genes, calculated with the help of binomial (.70 + .30)n (where n is the number of gene pairs, and 30 per cent of genes are believed to be derived from whites).
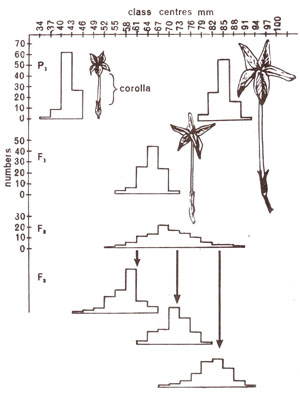
Fig. 4.5. Frequency distribution of lengths of corolla in two different varieties of Nicotiana longiflora used as parents and in F1, F2 and F3 generations derived from them (based on data of East).
Corolla length in Nicotiana longiflora
E.M. East (1916) used two varieties of
Nicotiana longiflora, which differed in corolla length, one with an average corolla length of 40.5 cm and the other with a corolla length of 93.3 cm. Being inbred for long time, these were presumably homozygous and variations within each of these varieties could, therefore, be attributed to environmental effects. When crosses were made between these two varieties, F
1 were uniform and had same degree of variation as found in parents. This variation, as in parents, could thus be due to environmental effect. In F
2 generation derived by selfing F
1 plants, variation was of a much higher order and was not comparable to variation recorded either in a parent or F
1. This variation, therefore, was only partly due to environmental effect and was mainly genetic.
That variation in F
2 was mainly genetic, could be proved when it was observed that mean value of F
3 derived from a single F
2 plant having a particular corolla length, depended only on that F
2 plant and differed greatly from other single plant F
3 progenies (Fig. 4.5). It was thus obvious that F
2 plants genetically differed. From observations, conclusions about number of genes involved can be drawn. We already know that if variations in intermediate types are ignored, then each parental type would be 1/4 (one out of every four) when one gene pair is involved; would be 1/16, when two gene pairs are involved; would be 1/64 when three gene pairs are involved and would be 1/256
, when four
gene pairs are involved (or
V4n, where
n = number of gene pairs). Since in a population of 444 F
? plants, East could not get a single plant of parental type, it is possible that more than four gene pairs are involved for corolla length in
Nicotiana longiflora.

Fig. 4.5. Frequency distribution of lengths of corolla in two different varieties of Nicotiana longiflora used as parents and in F1, F2 and F3 generations derived from them (based on data of East).
E.M. East extended the multiple factor hypothesis to several cases in plants. For instance, in case of maize it was demonstrated that the ear size is controlled by multiple factors. Similarly, flower size in tobacco had the same pattern of inheritance. In these and several other cases the genes controlling the character were many and usually more than two or three as outlined in two examples discussed in this section. A careful note at this place should be made of the fact that the ratios outlined above i.e., 1 : 4 : 6 : 4 : 1 or 1 : 6 : 15 : 20 : 15 : 6 : 1 are seldom, if ever realized. This is due to the presence of modifier genes for most of the quantitative characters. Moreover these quantitative characters are influenced by environment to a considerable degree, so that even if no modifiers are present, the true ratios may be disturbed.


