Crossing over between centromere and gene
(first and second division segregations).
In
Neurospora, products of meiosis are present in a linear order, so that
ordered tetrads are obtained.
Such a situation is not found in
Chlamydomonas although tetrad analysis can be conducted. Due to ordered tetrads in
Neurospora, a cross between normal
(a+) and mutant
(a) strain, will give rise to a linear arrangement of four normal spores
(a+) at one end followed by four mutant spores (
a) at the other end. Such an arrangement would be disturbed if crossing over occurs between centromere and the gene, because crossing over occurs at four strand and not at two strand stage. If crossing over at two strand stage was possible,
it would again lead to four normal spores followed by four mutant spores. Therefore, by analysing linear arrangement, a 4 : 4 arrangement will suggest absence of crossing over and a paired arrangement (24 :
2a : 24 :2
a or 2
A :4
a :2
A or 2
a :4
A :2
a) will suggest that crossing over has taken place between the gene and corresponding centromere. When crossing over is absent leading to 4 : 4 arrangement, this is described as
First Division Segregation (Fig. 11.6) and when crossing over takes place leading to paired arrangement, it is described as
Second Division Segregation. (Fig. 11.7, 11.8).
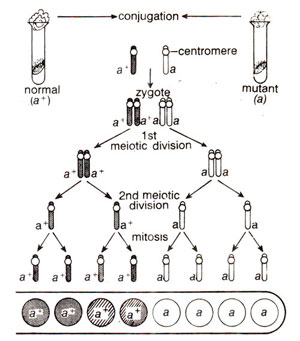
Fig. 11.6. Results showing first division segregation in a cross between normal (a+) and mutant (a) strains of-Neurospora, in which crossing over between the gene and centromere does not take place.

Fig. 11.7. Results of a linear order of ascospores (2:2:2:2) showing second division segregation in a cross between normal (a+) and mutant (a) strains of Neurospora, in which crossing over takes place between the gene and the centromere.

Fig. 11.8. Results of a linear order of ascospores (2:4:2) which is different than the one shown in Figure 11.7. but still showing second division segregation in a cross between normal (a+) and mutant (a) strains of Neurospora, in which crossing over takes place between the gene and the centromere.
Frequency of recombination between centromere and gene. In Neurospora, since crossing over between a gene and centromere leads
to second division segregation, the relative proportion of asci exhibiting second division segregation will give an estimate of crossing over. This will not be possible in
Chlamydomonas due to absence of ordered tetrads. As an illustration, in an experiment in
Neurospora, cross between albino (
al) and wild type
(al+) gave first division segregation
(al al al+ al+) in 129 asci and second division segregation
(al al+ al al+) in 141 tetrads. Since only two of the four strands undergo crossing over in second division segregation, recombination between centromere and the gene is
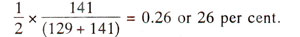
If a gene is located far away from centromere, crossing over may take place between the gene and centromere in each and every tetrad so that 100% tetrads should exhibit second division segregation. However, since in such cases, double crossovers, and multiple crossovers are also possible, some of the tetrads due to double crossover and other even number of crossover events, will give rise to first division segregation. Thus, second division segregation will never reach 100% level and in practice does not exceed 67% giving rise to only 33% recombination frequency
(½ x 67, since only two of the four chromatids are involved in crossing over). This 33% recombination frequency will actually represent 50 units or more. Therefore, recombination frequencies should not be estimated over long distances, but should be estimated over small distances to avoid underestimation due to double and even multiple crossovers.

Fig. 11.9. Production of ordered tetrads classified as parental ditype (PD), non-parental ditype (NPD) and tetratype (T) in a dihybrid (AaBb), with the genes A and B linked together (modified from Strickberger's "Genetics").
Detection of linkage between two genes. We have already discussed that tetrads can be of three types (i)
parental ditype (PD), (ii) non-parental ditype (NPD) and
(iii) tetratype (T). The linkage will be detected by comparing your results with the results one would expect on the basis of independent assortment. We have already discussed that if two parents
AB and
ab give rise to zygote
AaBb, it will give PD (2
AB : 2
ab), NPD (2
Ab : 2
aB)and T (1
AB : 1
Ab : 1
aB : 1
ab). If two genes are located on separate chromosomes and independent assortment holds good, PD and NPD tetrads should be equal and T-tetrads should be relatively fewer (since they result due to crossing over in one of the two pairs of chromosomes). On the other hand,
if linkage is there, then NPD will result due to four strand double crossovers and tetratype will result due to single crossover, so that the number of NPD tetrads will be much lower, not only in comparison to PD but also in comparison to T (Fig. 11.9). This will be illustrated with the help of some data. In
Neurospora, a cross between an adenine requiring strain
(ad) of mating type
A and a wild type strain (+) of mating type
a gave the results presented in Table 11.1.
Fig. 11.9. Production of ordered tetrads classified as parental ditype (PD), non-parental ditype (NPD) and tetratype (T) in a dihybrid (AaBb), with the genes A and B linked together (modified from Strickberger's "Genetics").
The data presented in Table 11.1 can be used for comparing PD and NPD and also for comparing NPD and T. It will be seen that PD and NPD are not significantly different, a result expected only in case of independent assortment. Further, tetratype (T) tetrads are fewer than NPD, a result, which is also expected only from independent assortment, although their frequency relative to the PD or NPD during independent assortment will be governed by the distance between the genes and their corresponding centromeres. It can, therefore, be concluded from the data that loci for
ad and
A are not linked and are located close to centromere (T tetrads are few).
It may be emphasized here that tetrads and not the ascospores or their pairs are considered as units. For instance, if tetrad ratio is 10 PD : 6 NPD, the difference may not be significant, but the ratio of meiotic products will be 40 PD : 24 NPD and the ratio of meiotic products will be 80 PD : 48 NPD, the differences in these cases being significant, thus leading us to erroneous conclusion of linkage.
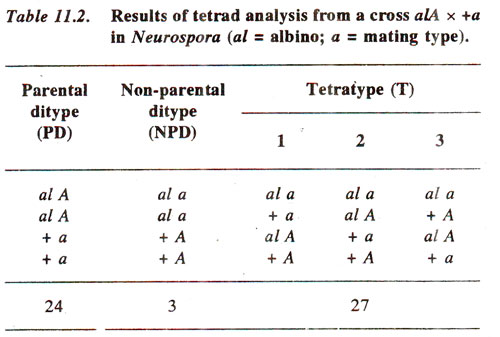
In another example of
Neurospora, an albino strain
(al) of mating type
A, and a wild type strain (+) of mating type
a produced the results shown in Table 11.2.
Since in this case, difference between PD (24) and NPD (3) is statistically significant and tetratypes exceed the number of NPD, the data suggest presence of linkage between the two loci.
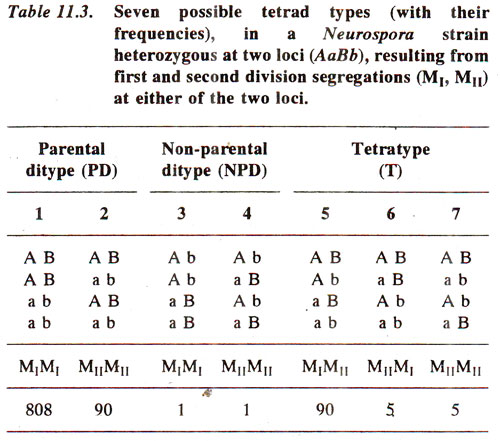
Preparation of linkage map. Data on tetrad analysis can be further utilized for determining linkage distances between genes. Distance between two genes can be sum of the distances of each irotn the centromere, if they are located on opposite arms or it will be difference of the distances of each gene from centromere if they are on the same arm. Once linkage is detected, one has to find out whether the two genes are on the same arm or on different arms. The relative frequencies of different orders in tetrads will help in deciding this fact. The different possible ordered tetrads obtained from the cross
AB x
ab are given in Table 11.3.
In the example used in Table 11.3, the two genes are linked
(AB/ab). In this case either of the two genes or both the genes may exhibit
first division segregation (MI) or
second division segregation (MII). If the order of loci is centromere-
A-
B, then the crossing over between A and B will produce M
I segregation for
A and M
II segregation for
B, as shown in Fig. 11.9 for tetratype (T) tetrads. On the other hand, crossing over between centromere and
A will give M
II segregation for both and absence of crossing over in the region 'centromere-
A-
B' will give M
I segregation for both the genes.
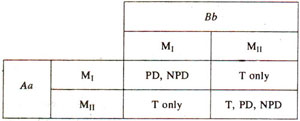
Fig. 11.10. The results of frrst and second division segregations (Mi, Mn) for two genes (Aa, Bb), showing that for the production of tetratype (T) tetrads, second division segregation for atleast one of the two genes is necessary.
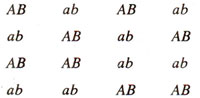
In Table 11.3, seven possible classes are given, but the order with in the half ascus was ignored, because it only reflects results of random spindle attachment. For instance PD shown in class 2 in Table 11.3, will include all the following four classes, which are equivalent, and can be obtained from each other by inverting top two and/or bottom two genotypes, as expected from random spindle attachment.
The PD, NPD and T types in Table 11.3 can be obtained by different combinations of M
I and M
II segregations of A and
B genes (Fig. 11.10), It may be seen that a tetratype can occur only where there is a crossover between atleast one locus and centromere. In other words for T type tetrads atleast one gene should exhibit M
II segregation.
Fig. 11.10. The results of frrst and second division segregations (Mi, Mn) for two genes (Aa, Bb), showing that for the production of tetratype (T) tetrads, second division segregation for atleast one of the two genes is necessary.
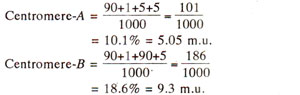
The distances of two genes from centromeres can be calculated as follows :
With the above information, following three possibilities exist : (i)
A and
B are on two different chromosomes, (ii)
A and
B are on two different arms of the same chromosome and (iii) A and
B are on the same arm of a chromosome, A lying between the centromere and
B. The first possibility should lead to independent assortment and can be ruled out, because PD and NPD are not equal and. T exceeds NPD. Since M
II segregation for both' genes exceeds the frequency of a class showing M
II segregation for either A or
B alone and since single crossovers will be more frequent than double crossovers, possibility (ii) above is less probable than the possibility (iii), which will give M
II segregation for both genes due to single crossover between the centromere and A.
Once it is ascertained that both genes are on the same arm, recombination frequency between
A and
B can be calculated. This distance can not be calculated by simple subtraction 9.30 - 5.05, because in calculating 9.30 we ignored double crossovers as in class 6 showing M
I segregation for
B (Table 11.3).
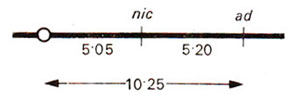
Fig. 11.11. A linkage map of genes A an B based on data presented in Table 11.3.
Since all the four products in NPD are recombinants and T has 50% recombinant products, the distance
A-B can be calculated as follows and a map can be drawn (Fig. 11.11).
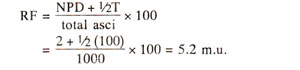
Fig. 11.11. A linkage map of genes A an B based on data presented in Table 11.3.