Photosynthesis–Irradiance Response Curve (P versus E curve)
 (5.30)
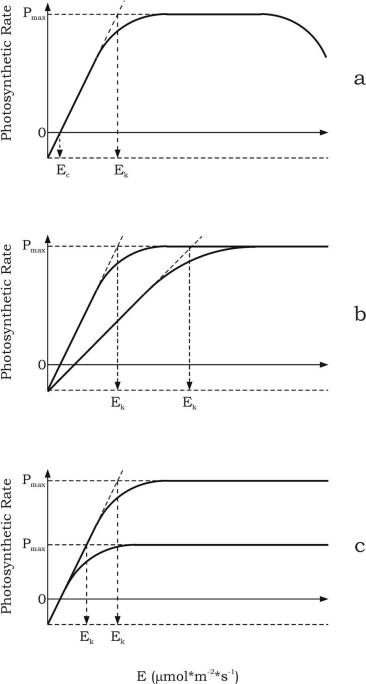
where PE is the photosynthetic rate at any irradiance E, Eλ is the spectral irradiance (in µmol m-2 sec-1) and Km is the half saturation costant when PE = Pmax/2 (Figure 5.15a).

FIGURE 5.15 Photosynthesis–irradiance response curves: Ec, irradiance compensation point; Ek, saturating irradiance; and Pmax: maximum photosynthetic rate. (a) typical plot; (b) comparison of two curves with different slopes: keeping constant the number of photosynthetic units, but increasing the functional absorption cross-section, the slope increases; and (c) comparison of two curves with different maximum photosynthetic rate: increasing the number of photosynthetic units, Pmax increases.
 (5.31)
where Eλ is the spectral irradiance and a is a measure of “photosynthetic efficiency,” or how efficiently solar energy is converted into chemical energy. α takes into account that the light absorbed by the algal cell is proportional to the functional absorption cross-section (σPSII) of the PSII (the effective area that a molecule presents to an incoming photon and that is proportional to the probability of absorption) and to the number of photosynthetic units (n):
 (5.32)
At very low irradiance level, the rate of oxygen consumption will be greater than the rate of oxygen evolution; hence, respiration is greater than photosynthesis and net oxygen evolution will be negative. Therefore, the P–E curve does not pass through the origin. The irradiance value on the x-axis at which photosynthesis balances respiration is called the light compensation point (Ec). Therefore, the Equation (5.30) becomes:
 (5.33)
As irradiance increases, more ATP and NADPH are produced, and the overall rate of photosynthesis becomes increasingly non-linear, rising towards its maximum or saturation level, Pmax. This pattern will continue until some other factors becomes limiting. By definition, in the light saturated region, the rate of photon absorption exceeds the rate of steady-state electron transport from H2O to CO2. Saturating irradiance, Ek, is defined as the point at which the extrapolated initial slope crosses Pmax. Ek represents a optimum on the photosynthesis irradiance curve.
 (5.34)
This equation says that increasing the number of photosynthetic units (but not their size) Pmax, that is, the saturation level, increases, and that Pmax cannot be derived from measurements of light absorption (Figure 5.15c). In other words, above the saturation point (Ek), the light-dependent reaction are producing more ATP and NADPH than can be used by the light-independent reaction for CO2 fixation, that is, increasing irradiance no longer causes any increase in photosynthetic rate. Above Ek and under normal condition, availability of CO2 is the limiting factor, because the concentration of CO2 in the atmosphere is very low (0.035% v/v).
Further increase in irradiance beyond light saturation can lead to a reduction in photosynthetic rate from the maximum saturation level. This reduction, which is dependent on both the irradiance and the duration of the exposure, is often termed photoinhibition. Photoinhibition can be thought as a modification of Pmax either by a reduction in the number of photosynthetic units or by an increase in the maximum turnover rate [Equation (5.34)]; thus photoinhibition leads a reduction in the photochemical efficiency of PSII, through a reduction in the population of functional (O2 evolving) reaction centers. Increasing irradiance levels increase the probability that more than one photon, two for example, strike the same reaction centers at the same time. The added energies of two blue photons, for example, could be very harmful as the resulting energy will correspond to a UV photon and could damage the chromophores.


