Polychromatic Flow Cytometry I
I. INTRODUCTION
The flow cytometer has proven to be one of the most powerful scientific techniques for the analysis of immunobiology in the past 35 years. Recent advances allowing the detection of 14 distinct cell parameters on each cell have revealed the immense heterogeneity of the immune system; e.g., the identification of more than 100 functionally distinct cell phenotypes in the peripheral blood of humans. In addition, the evolution in computer technology brings to bear the ability to analyze very large sample sets using sophisticated algorithms, increasing the power of analysis of lowfrequency cell populations.
Still, the use of high-end multicolor flow cytometry is in its infancy; many challenges must still be overcome before this technology will become routinely available in research laboratories. The most difficult obstacle at this time is reagent availability; many laboratories are forced to conjugate fluorochromes not yet available commercially. Many dyes are now available that can be conjugated easily to antibodies for use in polychromatic flow cytometry (PFC) to supplement the commercially available conjugates. With regard to instrument development, by far the most important requirement is automation. Instrument setup and calibration are still far more complex with the use of multiple lasers and detectors for PFC; computer-aided validation of instrument performance is necessary. In addition, automated compensation (fluorescence spillover) is necessary; however, this is adequately handled by most contemporary software packages.
This article presents some of the latest techniques used in our implementation of our 12-color flow cytometric technology. It discusses the reagents, calibration and setup, and analysis of the resulting data, including some of the hurdles and pitfalls encountered. This guide will aid research laboratories wishing to implement flow cytometric technology capable of more than 5 or 6 colors.
A. Monoclonal Antibodies
Purified monoclonal antibodies are available from manufacturers as bulk concentrated protein in the absence of any exogenous protein. All conjugations are performed as detailed (http://www.drmr.com/ abcon/). Large quantities of reactive fluorochromes are prepared and stored (and are stable for many months at 4C); the conjugation to antibodies is a fairly rapid procedure that can then be accomplished in 2-3 h.
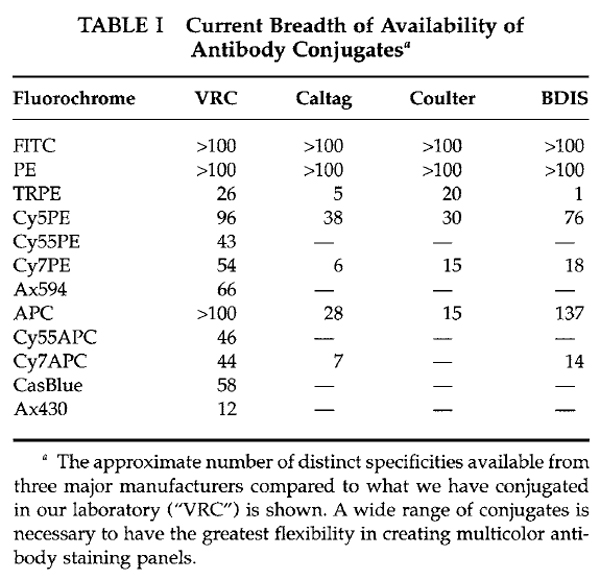
Figure 1 shows the common fluorochromes currently used in our laboratory, which can all be directly conjugated to monoclonal antibodies. Also shown are the excitation and emission spectra and suggested bandpass filters for each fluorochrome. Ideally, each fluorochrome should be conjugated to a wide variety of monoclonal specificities in order to provide a wide range of possible panels; of course, this requires a fairly substantial investment of both fluorochromes and monoclonal antibodies. New fluorochromes are becoming available that are more photo stable and easier to conjugate, such as the Alexa family of fluorochomes (i.e., Alexa, 488, 532, 660, 633, 647, and 680). Commercial manufacturers currently offer only a limited range of fluorochromes conjugated to specific monoclonal antibodies. Table I shows that only 7 of the 12 fluorochromes used in our laboratory are available commercially; this range is currently increasing but is still a limiting factor. In addition, newer conjugates have far more limited reagent combinations available until manufacturers can build up a significant inventory. Hence, it is likely that researchers who wish to perform more than 6-color flow cytometry will likely need to invest in the ability to manufacture reagents in-house. In general, this is incorporated most efficiently into a core facility that can supply reagents to multiple research laboratories.
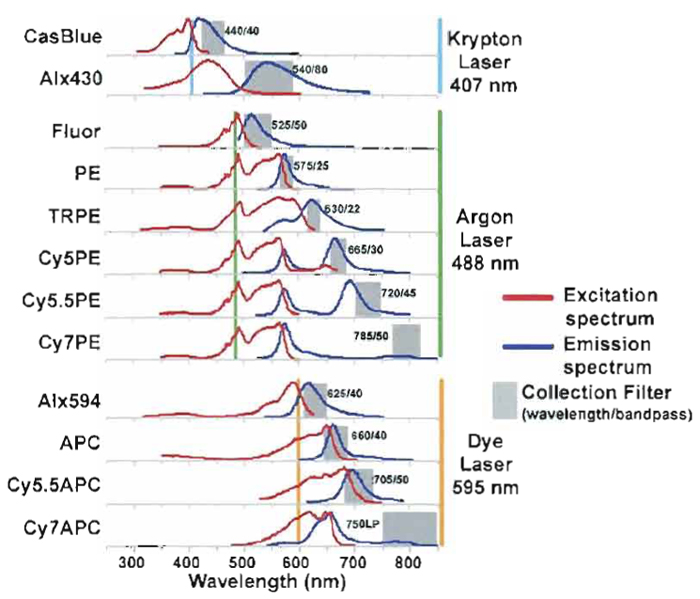 |
| FIGURE 1 Conjugate spectrum chart of excitation and emission curves for common fluorochomes used in PFC. Laser lines show which conjugates are excited by the individual laser lines and the selected bandpass filters used to measure the specific emission. |
 |
Regardless of the conjugate used (i.e., commercial or in-house), all mAbs require titration against a target cell population to determine the optimal concentration for staining. Note that staining conditions (temperature, time, and volume) impact the titration; thus, qualification should be performed under the same conditions as experimental staining. By plotting the median of the positive cell population against the serial dilution of the mAb as illustrated in Fig. 2, the lowest concentration at which the maximum separation can be discerned; in general, this is the optimal concentration to use (in this example, 10btg/ml). Lower concentrations of mAb result in loss of resolution (note, however, that for some mAbs the separation is still highly adequate at very low concentrations, allowing the use of the reagent at a more economical rate). It cannot be overemphasized that proper titration and selection of mAb concentration are paramount for successful multicolor analysis. Adding too much antibody conjugate can have as much effect on sample analysis as the addition of too little antibody conjugate. In this situation, backgrounds increase due to nonspecific binding of the antibody conjugate, thus reducing the signal-to-background ratio dramatically.
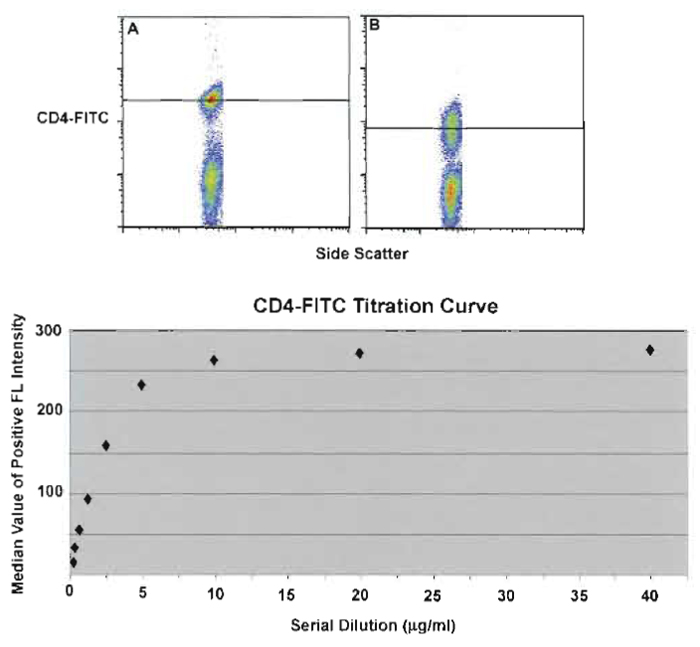 |
| FIGURE 2 Serial dilution of anti-CD4-FITC-labeled PBMCs and the median value of the positive signal (black line). (A) The point on the titration curve (10µg/ml) yielding the greatest separation (highest median value with the lower auto fluorescence) as compared to poor separation (B) at a lower titer (<2µg/ml). |
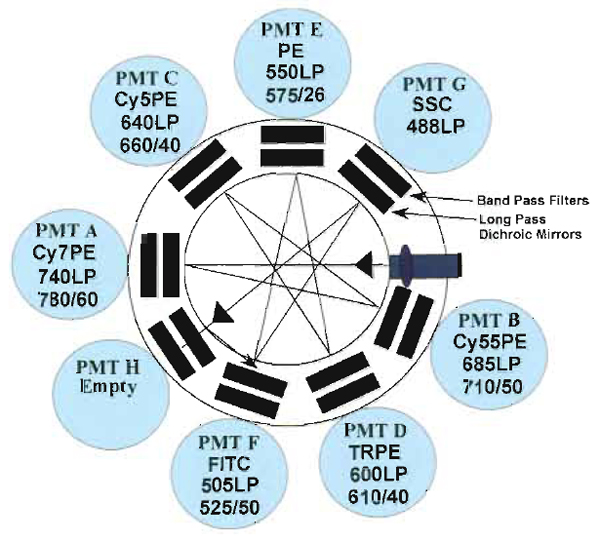
Samples are acquired on a modified FACSDiVa flow cytometer (BDIS, San Jose, CA), which measures 12 fluorescent parameters and 2 physical parameters (FS and SSC). Figure 3 illustrates the optical configuration and filter selection of this instrument. The geometry of this instrument is based on the traditional collection optics and is far more complex than more recent instrumentation using optical fibers such as the LSR II (BDIS). In these instruments, photons of light from the laser-excited conjugates are transmitted through optical fibers and measured in unique optical arrays. Figure 4 shows an example of an argon laser array containing eight detectors called an Octagon. The advantage of these systems includes increased efficiency of photon transfer, thus lower-energy lasers can be used with good signal reproducibility as compared to higher-end systems equipped with powerful lasers. Figure 5 shows the laser configuration of older traditional high-end systems as compared to newer instruments using low-powered diode lasers (5-10mW). Clearly another advantage of lower-power lasers and optical fibers is the smaller footprint, yielding a more compact system with the measurement capability of a high-end research instrument.
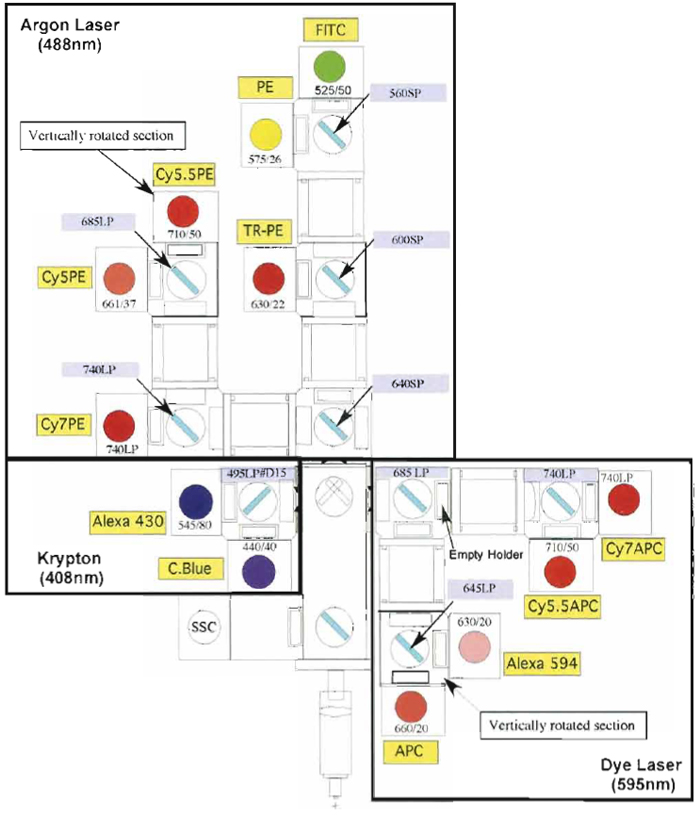 |
| FIGURE 3 Digital Vantage optical configuration used to detect 12 colors using three lasers: 488-nm argon, 408-nm krypton, and 595-nm dye lasers. Each section of detectors is outlined (black boxes) to indicate the laser associated with the emission. Also illustrated are the dichroic mirrors and bandpass filter combinations for each PMT. |
 |
| FIGURE 4 LSR II optical configuration of detectors for only the 488-nm diode laser. This configuration shows the light path with the typical dichroic mirrors and bandpass filters used to detect six different conjugates excited by this laser plus side scattered light. |
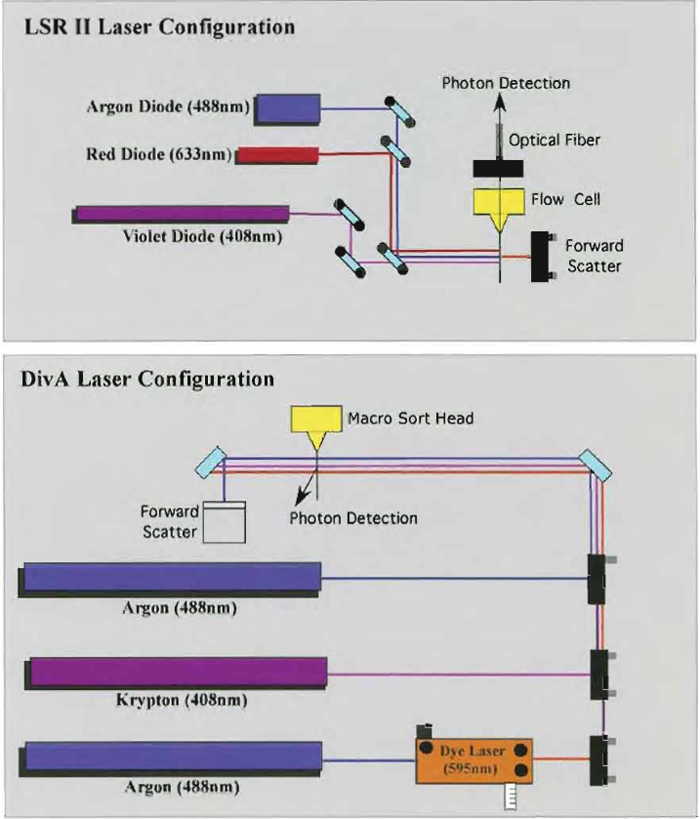 |
| FIGURE 5 Comparison between the Digital Vantage and the LSR II laser configuration system. Due to the use of the low-powered diode laser in the LSR II system, this instrument can be very compact and inexpensive to operate. |
Alignment beads containing a single peak bead (single peak Rainbow beads) are from Spherotech Inc. (Rainbow beads, Cat. No. RFP-30-5A). Calibration beads containing eight separate peaks (eight peak Rainbow beads) are from Spherotech Inc. (Rainbow beads, Cat. No. RFP-30-5A) and Blank Beads are from Becton Dickinson Immunocytometry Systems (Cat. No. RFP-30-5A). All beads are diluted by the addition of one drop (approximately 20µl) per milliliter of phosphate-buffered saline (PBS) containing 1% HIFCS (Quality BiologicalmPAA labs, Cat. No. 110-001-101) and 1 mg/ml of sodium azide (Sigma Chemical, Cat. No. S202).
E. Monoclonal Antibody Selection and Combinations
A laboratory Web-based database containing all of the antibody conjugate reagents is used to select the antibody conjugate combinations. This database lists the correct mAb concentration (determined from a titration curve; see the titration procedure in Section III) and displays the concentration, specificity, lot number, and location on a laboratory worksheet. Such databases become necessarymlaboratories doing 6-12 color flow cytometry will inevitably have a very large storehouse of reagents; it is necessary to have a centralized repository of the qualification and validation data for each reagent in an easily accessible location. Researchers planning experiments need access to this information in order to know how much of each reagent to use, as well as some idea of the quality of the staining that can be expected with that reagent.
Latex beads coated with anti-mouse κ antibody are from Becton Dickinson Immunocytometry Systems (Cat. No. 557640). After incubating with mAb conjugate, beads are fixed in a final concentration of 0.5% paraformaldehyde (PFA). These "capture" beads are used with each antibody conjugate tested to set up the compensation matrix.
III. PROCEDURES
A. Alignment and Instrument Calibration
All flow cytometers, regardless of engineered advances in alignment techniques, require alignment and calibration quality control to determine reproducibility and sensitivity. For this purpose, alignment beads and calibration standards must be stable and reproducible from day to day. It is important to point out that such quality control measurements are not a substitute for proper cell controls as outlined in this article to assure testing quality. Alignment beads are used to determine good instrument performance and, if successful, should determine proper light collection in all detectors as measured by fluorescence intensity and fluorescence CV at a consistent voltage. Once the instrument lasers are aligned properly, calibration beads can be used to determine the correct tolerance range of fluorescent intensity by adjusting the detector sensitivity (e.g., photomultiplier voltage). These tolerance ranges are determined by unstained cell analysis set to a predetermined value. In addition, calibration standards determine the signal-to-background ratio, which must remain consistent within at most a 5% variation.
- Place diluted single peak Rainbow beads onto the sample insertion tube and adjust the sample pressure to approximately 600 beads per second.
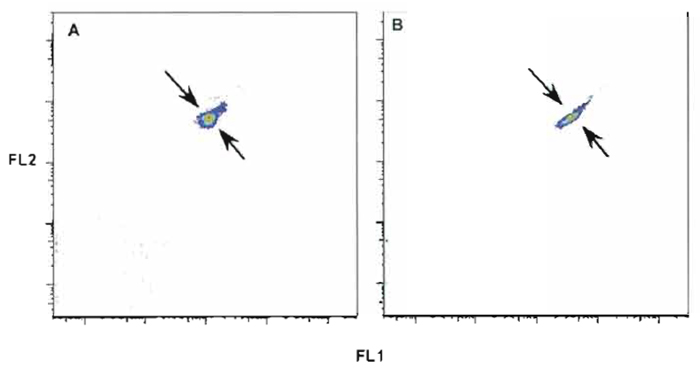
- While observing dual-parameter histograms of FS vs SSC and all other fluorescence parameter combinations, adjust instrument to achieve the narrowest CV and highest intensity possible according to the manufacturer's instructions. Figure 6 shows the incorrect (A) and the correct (B) display for two fluorescence parameters. It is important to note that while slight misalignments may have only a small impact on the measurement of any given single parameter, they can have a serious impact on the visualization of data after compensation (Roederer, 2001a,b). This is because the spread in compensated data is directly related to the efficiency of light collection; larger CVs, as illustrated in Fig. 6, result from decreased light efficiency and result in much poorer data quality after compensation.
- Adjust the voltages for each PMT to result in predetermined intensity levels for the bead population. Such levels are defined previously as optimal for the particular types of samples that are being analyzed; this calibration procedure ensures that the instrument sensitivity is comparable across experiments, allowing for the best comparison of data. As an example, for the analysis of lymphocytes, we typically analyze completely unstained lymphocytes and adjust the PMT voltages such that the upper end of the unstained cells is at the top of the first (of four) decades of fluorescence. Then the beads are reanalyzed at those voltages and the intensities are recorded for future target settings. These same voltage settings are used for sample acquisition and instrument calibration.
- Place diluted eight peak Rainbow beads onto the sample insertion tube and adjust the sample pressure to approximately 600 beads per second.
- Collect and save all single parameter histograms for future analysis.
- Place diluted Blank beads onto the sample insertion tube and adjust the sample pressure to approximately 600 beads per second.
- Collect and save all single parameter histograms for future analysis.
- From data collected on the single peak beads, chart voltage versus time. Correct tolerances for each PMT should be ±5% variance.
- Data collected on the eight peak beads (median channel of the eight peak) divided by the median channel of the blank bead yield the signal-to-background ratio (see Fig. 7). Each PMT will have a characteristic S/B ratio; however, the correct tolerance plotted against time should produce a range of ±10%.
 |
| FIGURE 6 Rainbow beads with incorrect (A) and correct (B) alignment of two fluorescent parameters. Tolerance ranges for the coefficient of variance and fluorescent intensity are established for all instrument parameters. Setting quality control of all parameters within these tolerance ranges can avoid incorrect alignment and compensation error. |
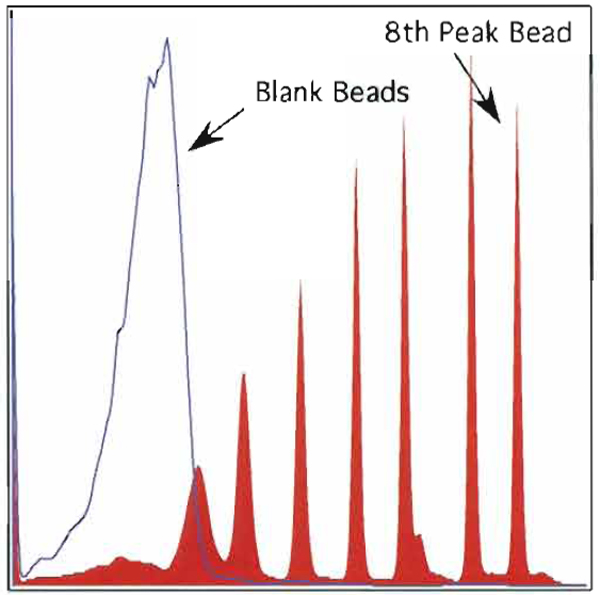 |
| FIGURE 7 An overlay of eight peak rainbow beads with blank beads of I of the 12 parameters. The signal/background ratio is calculated using the median channel of the eighth peak bead and dividing by the median channel of the blank bead. |
Compensation and analysis of samples can be done either online or after data collection with appropriate software. In general, if cell samples are sorted, the user must perform compensation online; however, in most cases, sample compensation and analysis are performed off-line. Regardless of when compensation is performed, the same rules apply to correctly compensate the sample. It is important to note that each experiment must have matching compensation controls. These controls must produce signals, which are of as high or higher fluorescence intensity than the test sample. In many cases the use of compensation beads will satisfy this condition; however, if any of the experimental samples are more than severalfold brighter than the beads, then single-stained cells of the appropriate reagents must be used as compensation controls. In addition to matched compensation controls, a negative (unstained beads) must be collected. This control and individually labeled compensation tubes are used in the compensation algorithm to calculate compensation. Finally, to verify cell autofluoresence relative to the unstained bead location, an unstained cell sample control must be collected. Online compensation for the FACSDiVa is described later. Figure 8 shows an example of compensation beads labeled with anti-CD8 APC. Figure 8A shows the location of unstained beads as compared to the stained beads in Fig. 8B. As expected, the degree of spillover for the excitation of APC from the argon into the Cy5PE channel is negligible (Fig. 8C). However, the dye laser (595 nm) excites APC and the spillover is seen in the Cy55APC channel. This will require compensation correction of the Cy55APC channels due to the spillover of APC (Fig. 8D). As shown in Fig. 9, the degree of compensation (percentage of spillover) or light contamination can be considerable, and the complexity of this issue is only magnified by the addition of multiple parameters. A detailed explanation of compensation and controls is beyond the scope of this article; however, additional information can be found at http://www.drmr.com/compensation/index.html.
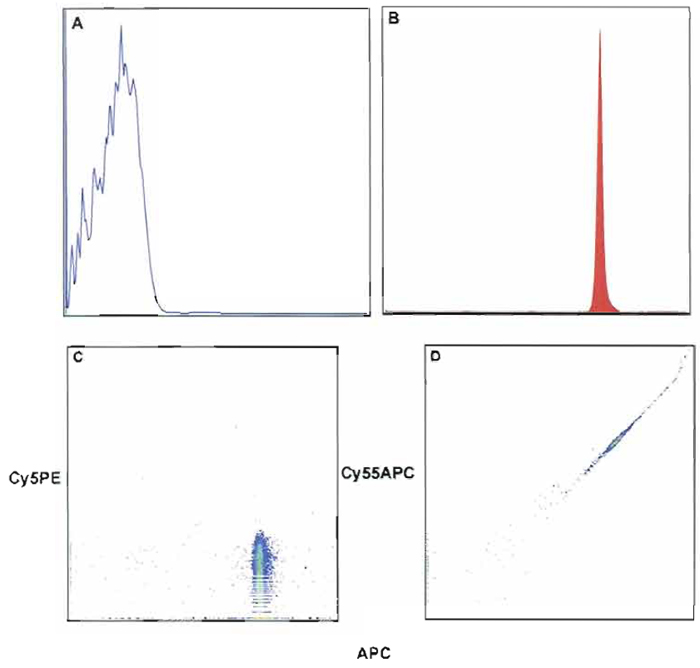 |
| FIGURE 8 Fluorescent intensity of unstained (A) compensation beads (anti-mouse κ) and stained beads with anti-CD8 APC (B). (C and D) The effect of contaminated light from the excitation of CD8- APC. In C, no ompensation is required because no contaminating light or spillover occurs into the Cy5PE channel. However, D shows that compensation correction is required because of the large spillover of contaminating light into the Cy55APC channel. After applying compensation correction, D will appear like C. |
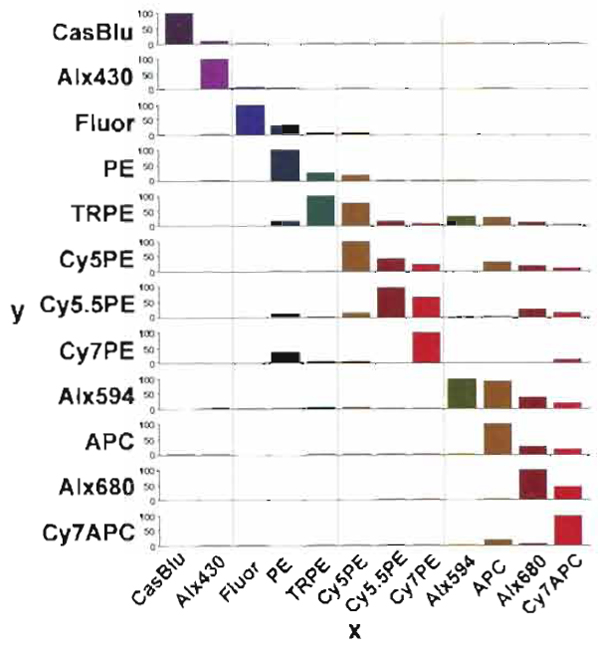 |
| FIGURE 9 Compensation percentage of contaminated light, which must be subtracted from all of the other detectors for accurate analysis. The x axis shows the signal, and the y axis indicates the percentage of contaminated light removed from the signal. In general the largest contamination occurs within the same laser excitation group. |
- Into a 12 × 75 test tube add 40 µl of compensation beads (mouse anti-κ beads) and the volume of a previously tittered antibody conjugate. Dilute volume to 100µl with PBS containing 1 mg/ml of sodium azide and 1% fetal calf serum (FCS). Note that each antibody conjugate tested will have a single stained tube for the compensation control used in the experiment. Each compensation control tube will be used to set the compensation matrix.
- Incubate in the dark for 15min at room temperature.
- Wash once in PBS containing 1 mg/ml of sodium azide and 1% FCS.
- Remove supernatant and resuspend in 250µl of PBS containing 1 mg/ml of sodium azide and 1% FCS.
- Vortex and add 250µl of 0.5% PFA.
- Acquire each compensation control tube and the unstained bead control on the flow cytometer using previously defined voltage settings.
- Set automated compensation matrix either on the instrument or by off-line software. Once completed, the test sample is correctly compensated and is ready for acquisition.
- Compensation should be checked frequently by acquiring cell samples stained with combinations of antibody conjugates. After applying the compensation matrix, median values of the unstained cells should match the median values of the positive cells.
Steps and Considerations
- Altering sample pressure and sheath velocity should be avoided. When possible, cells should be analyzed at low sheath pressure to ensure greatest sensitivity; increasing sample pressure increases the CV of the measurement, thus affecting alignment and compensation negatively. Therefore, it is recommended to maintain the lowest useful sample pressure and sheath velocity.
- Collecting enough events for statistical analysis is key. However, the number of events needed for 12- color analysis is no different than for 2-color analysis. What is important is the size of the population of cells of interest. For example, if the subset of interest represents 0.1% of the input population, then collecting 1 million events yields 1000 events of the subset of interest. In general, 1000 events is more than enough for phenotypic analysis; for quantitative enumeration, a count of 1000 has an associated precision of 3% (i.e., the square root of 1000 divided by 1000). If a 1% precision was required, then 10 million events of the original sample need to be acquired.
- Particle size and cell aggregates should be considered before sample collection. In addition to sample clogging the macro-sort tip, small changes in alignment can alter fluorescent intensity, compensation, and forward scatter detection. In general, if the particle size is greater than one-fourth the size of the macro-sort tip, the user should consider a larger macro-sort tip. Alternatively, cell aggregates can be avoided by prefiltering samples through a 100-µm filter cap tube prior to sample acquisition.
Steps and Considerations
- Fluorescence minus one (FMO) control refers to a staining strategy, which uses all mAbs in the staining mix as in the test sample except for one mAb. This method allows for the correct determination of gate selection and verification of cell percentages. Figure 10 shows an example of the FMO strategy. In this example, cells were stained with four colors: anti-CD3-FITC, anti-CD4-PE, anti-CD8-Cy5PE, and anti-CD45RO-Cy7PE. The FMO control lacked anti-CD4-PE. In Fig. 10A, the sample is compensated correctly and shows that the FMO control is a better indicator of negative cell control cursor position than the unstained control sample (compare line 1 and line 2). Figure 10B demonstrates that even poorly compensated samples can benefit from the FMO control sample (compare line 1 and line 2). After setting the positive gate cutoff the test sample percentages can be determined more accurately. Thus this control reduces false negatives (best specificity) and better identifies positive cell populations (lower sensitivity). In addition, the FMO control can help identify compensation issues within the test sample. Therefore, FMO controls should be used whenever accurate discrimination is essential or when antigen expression is relatively low. While theoretically there could be as many FMO controls for each staining combination as there are colors, in reality most of these are not necessary. For example, in many cases (e.g., CD3 or CD8 staining), the distinction of positive and negative cells is made easily enough based on visual inspection. In no case, however, is a completely unstained (or completely isotype-stained) sample the appropriate control for setting discriminatory gates.
- Use only titered antibody conjugates prior to use in combinations as described earlier.
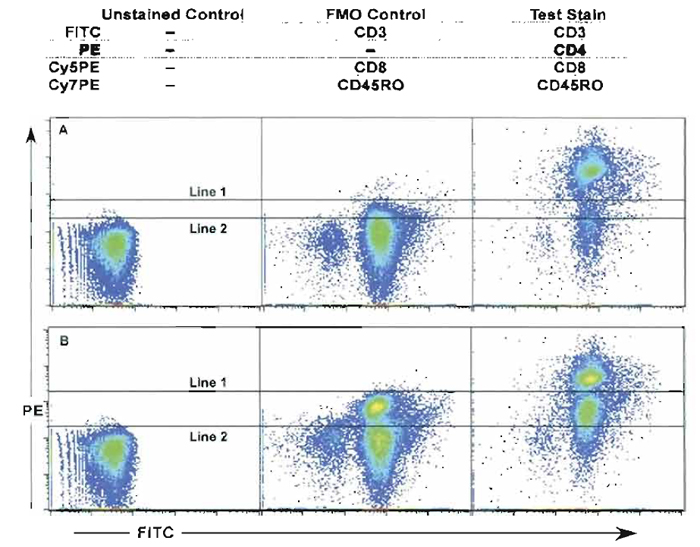 |
| FIGURE 10 Use of the FMO control (fluorescence minus one) stained with all mAbs except for anti-CD4- PE. (A and B) The unstained control, the FMO control, and the fully stained cell sample (anti-CD3-FITC, anti- CD4-PE, anti-CD8-Cy5PE, and anti-CD45RO-Cy7PE) are compared. (A) The sample is compensated correctly and shows that the FMO control is a better indicator of negative cell control cursor position than the unstained control sample (compare line 1 and line 2). (B) Even samples that are poorly compensated can benefit from the FMO control sample (compare line 1 and line 2). |
A. Sample Viability
Dead cells will bind many antibody conjugates nonspecifically and erroneously count these as a positively labeled cell. Therefore, gating strategies must be employed to properly gate out these cells. Intercalating dyes such as ethidium monoazide (EMA) or propidium iodide (PI) can be useful in gating out these nonspecifically labeled cells. One advantage of the use of PI over EMA is the ability to use the same channel (Cy5PE channel) for both PI and another mAb stained with Cy5PE. This can be done due to the high intensity of PI over most mAbs sharing this channel. Figure 11 shows an example of EMA used as a dead cell discriminator. In this example, unfixed cells were stained with 0.5 µg/ml of EMA (Molecular Probes Inc, Cat. No. E1374) for 10min on ice covered with aluminum foil followed by 15 min under a bright fluorescent light. Samples can be fixed with 2% PFA and run within the same day. Dead cells are labeled positive with EMA, as seen in Fig. 11B, and can be removed from the gated live cells (live cell gate, B). Without the use of EMA, Fig. 11A shows the total number of dead cells and live cells combined. Cells within a standard light scatter gate could contain dead cells as shown in Fig. 11A; however, after the dead cells were gated out using the live cell gate in Fig. 11B, the dead cells were removed from the analysis (Fig. 11C).
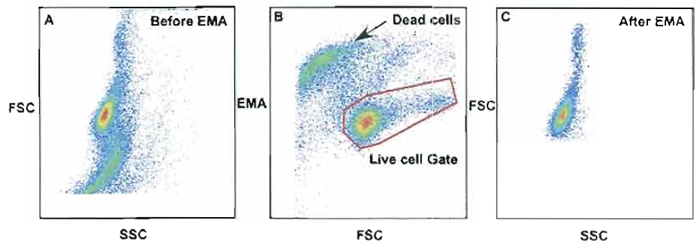 |
| FIGURE 11 Use of ethidium monazide (EMA) as a method to discriminate live cells from dead cells. Dead cells are labeled positive with EMA as seen in B and can be removed from gated live cells (live cell gate). Without the use of EMA, A shows the total number of dead cells and live cells combined. Cells within a standard light scatter gate could contain dead cells as shown in A; however, after the dead cells were gated out using the live cell gate in B, dead cells were removed from the analysis (C). |
Cyanine conjugates can potentially form immune complexes or aggregates during storage. Typically, cyanine tandem dyes form these aggregates and must be removed before using in the staining procedure. Ultracentrifugation of the antibody conjugate mixture at 13,000g for 3 min will remove these aggregates.
V. CONCLUSION
Routine polychromatic flow cytometry is now closer to reality than ever before. Recent advances in instrumentation, computer technology, and biochemistry will prove to be the ingredients necessary to successfully understand the human immune system (Eckstein et al., 2001; Roederer et al., 1997). As engineering goals meet science objectives, the last frontier to cross will be analysis and comprehension of data never seen before or not very well understood. It will be this area where intense effort is needed to understand the massive amount of information collected and interpreted. Nonetheless, significant hurdles remain to be crossed by all laboratories wishing to implement this technology, and significant education of all immunologists regarding the interpretation of data generated by this technology is crucial to the understanding of its vagaries.
References
Baggerly, K. A. (2001). Probability binning and testing agreement between multivariate immunofluorescence histograms: Extending the chi-squared test. Cytornetry 45, 141-150.
De Rosa, S. C., Herzenberg, U A., and Roederer, M. (2001). 11-color, 13-parameter flow cytometry: Identification of human naive T ceils by phenotype, function, and T-cell receptor diversity. Nature Med. 7, 245-248.
Roederer, M. (2001a). Compensation is not dependent on signal intensity or on number of parameters. Cytometry 46, 357-359.
Roederer, M. (2001b). Spectral compensation for flow cytometry: Visualization artifacts, limitations, and caveats. Cytometry 45, 194-205.
Roederer, M., De Rosa, S., Gerstein, R., Anderson, M., Bigos, M., Stovel, R., Nozaki, T., Parks, D., and Herzenberg, L. (1997). 8 color, 10-parameter flow cytometry to elucidate complex leukocyte heterogeneity. Cytometry 29, 328-339.
Roederer, M., and Hardy, R. R. (2001). Frequency difference gating: A multivariate method for identifying subsets that differ between samples. Cytometry 45, 56-64.
Roederer, M., Moore, W., Treister, A., Hardy, R. R., and Herzenberg, U A. (2001a). Probability binning comparison: A metric for quantitating multivariate distribution differences. Cytometry 45, 47-55.
Roederer, M., Treister, A., Moore, W., and Herzenberg, L. A. (2001b). Probability binning comparison: A metric for quantitating univariate distribution differences. Cytometry 45, 37-46.
Support our developers


