Ratiometric Pericam
Our understanding of the structure-photochemistry relationships of green fluorescent protein (GFP) (Tsien, 1998) has enabled the development of genetic calcium probes based on a circularly permuted GFP (cpGFP) in which the amino and carboxyl portions have been interchanged and reconnected by a short spacer between the original termini (Baird et al., 1999). The resulting new amino and carboxyl termini of the cpGFP have been fused to calmodulin and its target peptide M13, generating a chimeric protein named pericam (Nagai et al., 2001). This new protein was fluorescent, and its spectral properties changed reversibly with Ca2+ concentration, probably due to the interaction between calmodulin and M13, which alters the environment surrounding the chromophore. Three types of pericam have been obtained by mutating several amino acids adjacent to the chromophore. Of these, "flash pericam" becomes fluorescent with increasing Ca2+, whereas "inverse pericam" dims. However, "ratiometric pericam" has an excitation wavelength that changes in a Ca2+-dependent manner, thereby enabling dual-excitation ratiometric Ca2+ imaging. Ratiometric dyes permit quantitative Ca2+ measurements by minimizing the effects of several artifacts that are unrelated to changes in the concentration of free Ca2+ ([Ca2+]), such as uneven loading or partitioning of dye within the cell or varying cell thickness. This article presents an outline of an imaging experiment using HeLa cells expressing ratiometric pericam to measure receptor-stimulated changes in intracellular [Ca2+] ([Ca2+]i) (Protocol 1).
HeLa cells (ATCC # CCL-2.2)
Culture medium: Add fetal bovine serum (Gibco BRL, Life Technologies) to Dulbecco's modified Eagle's medium (DMEM) (Sigma Aldrich) to a final concentration of 10% (v/v)
Hank's balanced salt solution (HBSS): Dissolve CaCl2 (0.14g), KCl (0.40g), KH2PO4 (0.06g), MgCl2·6H2O (0.10g), MgSO2·7H2O (0.10g), NaCl (8.00g), NaHCO3 (0.35g), Na2HPO4 (0.048g), and D-glucose (1.00 g) in 800ml of distilled H2O, adjust the pH to 7.4, and then adjust the volume to 1 liter.
Histamine solution: Dissolve 1.841 mg of histamine dihydrochloride (Sigma Aldrich, H7125) in 1 ml of HBSS to make a 10 mM stock solution.
Ratiometric pericam cDNA
Ratiometric pericam mitochondrial cDNA
35-mm glass-bottom cell culture plates (Matsunamiglass, Osaka, Japan)
Interference Filters
400DF15, XF1006, Omega
485DF15, XF1042, Omega
535AF45, XF3084, Omega
505DRLP, XF2010, Omega
505DRLP-XR, XF2031, Omega
500ALP, XF3092, Omega
DM420SP, Olympus
FV5-DM442, Olympus
BA505-525, Omega
III. INSTRUMENTATION
A. Conventional Microscopy for Time.Lapse [Ca2+]i Imaging
Dual-excitation imaging with ratiometric pericam uses two excitation filters (485DF15 and 400DF15), which are alternated by a filter changer (Lambda 10-2, Sutter Instruments, Novato, CA), a 505DRLP-XR dichroic mirror, and a 535AF45 emission filter. The excitation and emission spectra of ratiometric pericam in the presence and absence of Ca2+ with passbands of the emission filter and two excitation filters are shown in Fig. 1A. Also, the transmittance of the dichroic mirror (505DRLP-XR) is superimposed. The dichroic mirror has an eXtended Reflection region below 505nm; it was designed originally for the measurement of Ca2+ (fura-2) and pH (BCECF). In this situation, the broad reflection of a dichroic mirror is imperative. A more common long-pass dichroic mirror (505DRLP) cannot be used; superimposition of its transmission spectrum (Fig. 1B) makes one notice a complex transmission band at short wavelengths, which prevents reflection of the 400-nm light. The author strongly recommends that researchers make graphs of spectra plotted as percentage transmittance for the interference filters (excitation filters, emission filters, and dichroic mirrors) that are actually used, together with excitation and emission spectra of the relevant fluorescent dyes. The transmittance curves for the filters (normal incidence) and dichroic mirrors (45° incidence) can be measured easily using a conventional spectrophotometer. This measurement also provides a chance for researchers to check the quality of their interference filters, which may deteriorate with time.
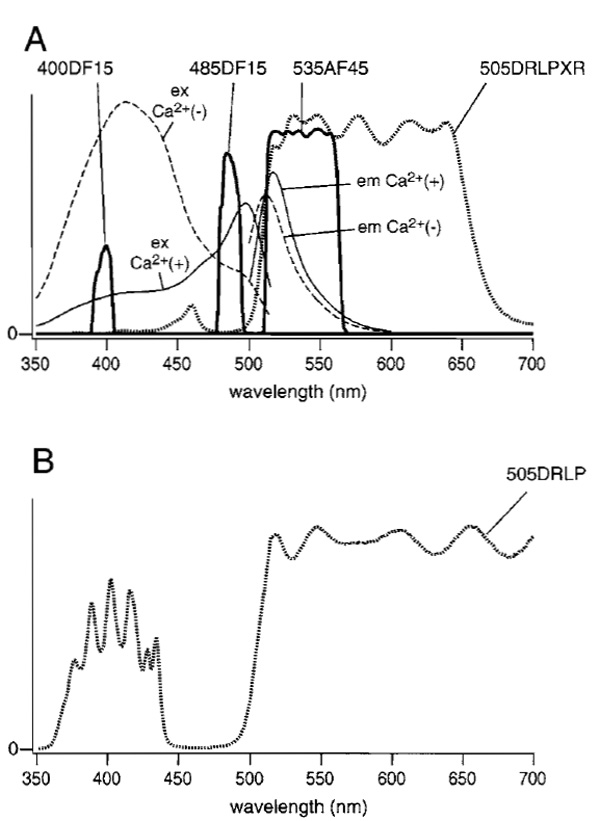 |
| FIGURE 1 (A) Fluorescence excitation and emission spectra of ratiometric pericam in the presence (solid line) and absence (broken line) of Ca2+. Transmittance spectra for filters (400DF15, 485DF15, and 535AF45) and the dichroic mirror (505DRLPXR) are shown with solid and dotted lines, respectively. (B) The transmittance spectrum for a 505DRLP dichroic mirror. |
Although the following procedure assumes familiarity with LSCM, and with the Olympus LSCM in particular, the procedure can be adapted easily to other LSCM types. The microscope and lasers we use are described in Fig. 2. The beam from a diode-pumped solid-state laser (Sapphire 488-20, COHERENT) directly enters an AOTF (AOTF1; AOTE8C, AA Opto- Electronic). The light is relayed through an optical fiber (FV5-FUR, Olympus) to a confocal microscope scan head and passes through a dichroic mirror (DM1; DM420SP, Olympus). A laser diode (NLHV3000E, NICHIA) is mounted on a heat sink with temperature control, which consists of an LD mount and heat sink [F125-4A (Suruga Seiki)], LD current driver [LDX-3525 (ILX Lightwave)], and LD temperature controller [LDT5525 (ILX Lightwave)]. The output of the laser diode is collimated (made parallel) using multiple lenses, and its power is stabilized by a feedbackregulated device. The beam is directed into another AOTF (AOTF2; AOTE4C UV, AA Opto-Electronic). The diffracted light is sent through another fiber-optic line (FV5-FUR-UV, Olympus) to the scan head and is then reflected on DM1. The two AOTFs are controlled electronically, allowing the reciprocal choice of one of the two laser lines. The chosen laser beam is reflected on a second dichroic mirror (DM2; FV5-DM442, Olympus). The scan head is coupled to an inverted microscope (IX70, Olympus) through its right-side port. The objective lens used is a PlanApo 60× N.A. 1.00 WLSM (Olympus). The fluorescent light is descanned, passed through DM2, a pinhole, and an emission filter (BA505-525 (Omega)), and detected by a photomultiplier. Fluorescence signals with excitation wavelengths of 408 and 488nm are distributed into two channels during analog-to-digital conversion. The pair of galvanometer mirrors, the digitized detector output, and the AOTF controller are orchestrated. The excitation and emission spectra of ratiometric pericam in the presence and absence of Ca2+ , together with the passband of the emission filter (BA505-525) and the two laser lines, are shown in Fig. 3.
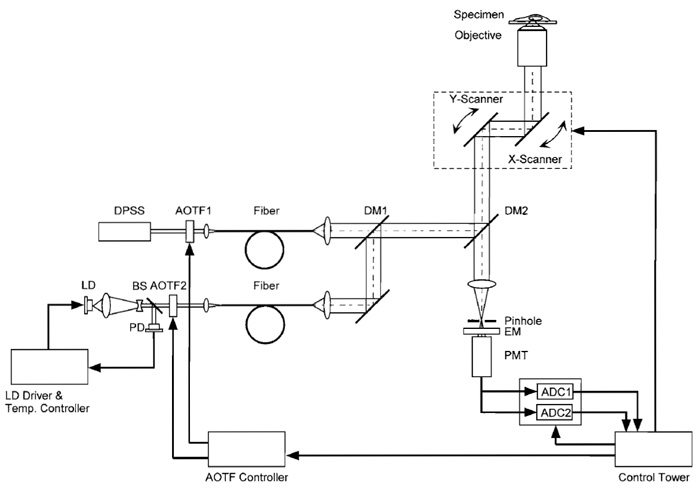 |
| FIGURE 2 Schematic diagram of the laser-scanning confocal microscopy system for fast dual-excitation ratiometric imaging. DPSS, diode pumped solid-state laser; LD, laser diode; PD, photodiode; BS, beam splitter; DM, dichroic mirror; EM, emission filter; PMT, photomultiplier tube; ADC, analog-to-digital converter. |
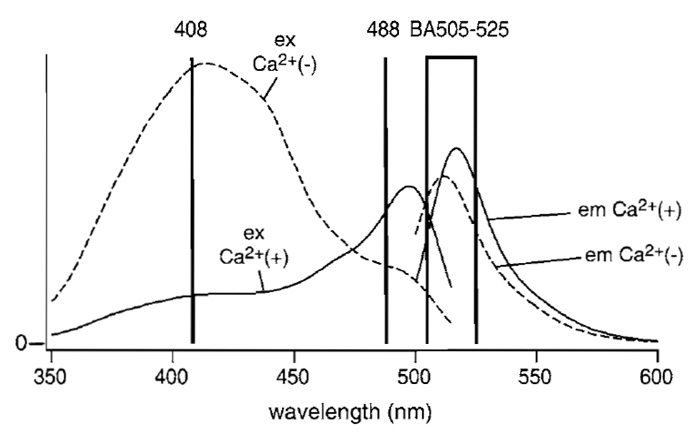 |
| FIGURE 3 Fluorescence excitation and emission spectra of ratiometric pericam in the presence (solid line) and absence (broken line) of Ca2+. The wavelengths of the two laser lines, 408 nm (laser diode) and 488nm (diode-pumped solid state), are indicated by vertical lines. The wavelengths that pass through the emission filter BA505-525 are shown by a box. Modified with permission from T. Nagai, A. Sawano, E. S. Park, and A. Miyawaki, Proc. Natl. Acad. Sci. U.S.A. 98, 3197 (2001). Copyright (2001) National Academy of Sciences, U.S.A. |
Protocol 1
The procedure for time-lapse [Ca2+]i imaging in HeLa cells is as follows.
- Plate HeLa cells or cells of interest onto a 35-ram glass-bottom dish with culture medium.
- Transfect the cells with 1Bg per dish of cDNA encoding ratiometric pericam mitochondria using Lipofectin according to the manufacturer's instructions.
- Between 2 and 10 days after cDNA transfection, image HeLa cells on an inverted microscope (IX7) with a cooled CCD camera (MicroMax or Cool Snap HQ, Roper Scientific, Tucson, AZ). Expose cells to reagents in HBSS containing 1.26 mM CaCl2. Image acquisition and processing are controlled by a personal computer connected to a camera and a filter wheel (Lambda 10-2, Sutter Instruments, San Rafael, CA) using the program MetaFluor (Universal Imaging, West Chester, PA). The excitation filter wheel in front of the xenon lamp (Lambda 10-2, Sutter Instruments, San Rafael, CA) is also under computer control. Excitation light from a 75-W xenon lamp is passed through a 400DF15 (400 ± 7.5) or 485DF15 (485 ± 7.5) excitation filter. The light is reflected onto the sample using a 505-nm longpass (505DRLP-XR) dichroic mirror with an extended reflection. The emitted light is collected with a 40X (numerical aperture: 1.35) objective and passed through a 535 ± 22.5-nm band-pass filter (535AF45). Interference filters are from Omega Optical or Chroma Technologies (Brattleboro, VT).
- Define several factors for image acquisition, including (i) excitation power, which depends on the type of light source and neutral density filter, (ii) numerical aperture of the objective, (iii) time of exposure to the light, (iv) image acquisition interval, and (v) binning. The last three factors should be considered in terms of whether temporal or spatial resolution is pursued.
- Choose moderately bright cells. Select regions of interest so that pixel intensities are averaged spatially.
- At the end of an experiment, convert fluorescence signals into values of [Ca2+]. Rmax and Rmin can be obtained as follows. To saturate the intracellular indicator with Ca2+, increase the extracellular [Ca2+] to 10-20mM in the presence of 1-5 µM ionomycin. Wait until the fluorescence intensity reaches a plateau. Then, to deplete the Ca2+ indicator, wash the cells with Ca2+-free medium (1 µM ionomycin, 1 mM EGTA, and 5 mM MgCI2 in nominally Ca2+-free HBSS). The in situ calibration for [Ca2+] uses the equation [Ca2+] = K'd[(R - Rmin)/(Rmax- R)](1/n), where K'd is the apparent dissociation constant corresponding to the Ca2+ concentration at which R is midway between Rmax and Rmin and n is the Hill coefficient. The Ca2+ titration curve of ratiometric pericam can be fitted using a single K'd of 1.7 µM and a single Hill coefficient of 1.1 (Fig. 4). A typical time course of [Ca2+]i reported by ratiometric pericam is shown in Fig. 5.
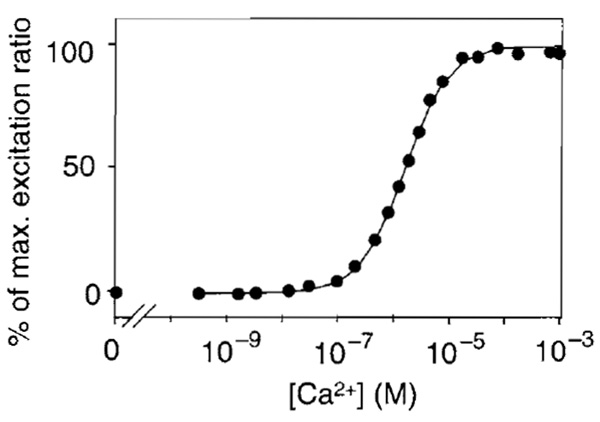 |
| FIGURE 4 The Ca 2+ titration curve of ratiometric pericam. Modified with permission from T. Nagai, A. Sawano, E. S. Park, and A. Miyawaki, Proc. Natl. Acad. Sci. U.S.A. 98, 3197 (2001). Copyright (2001) National Academy of Sciences, U.S.A. |
![FIGURE 5 Typical [Ca2+] i transients and oscillations induced by receptor stimulation in HeLa cells expressing ratiometric pericam. The sampling interval was 3-5s. (Top) Excitation ratios of 480 and 410 nm. The righthand ordinate indicates [Ca2+]i in µM with Rmax and Rmin indicated by an arrow and arrowhead, respectively. (Bottom) Excitations of 480nm (black line, left-hand scale) and 410nm (gray line, right-hand scale). Modified with permission from T. Nagai, A. Sawano, E. S. Park, and A. Miyawaki, Proc. Natl. Acad. Sci. U.S.A. 98, 3197 (2001). Copyright (2001) National Academy of Sciences, U.S.A.](images/v2_pb_s08_c41_f05.jpg) |
| FIGURE 5 Typical [Ca2+] i transients and oscillations induced by receptor stimulation in HeLa cells expressing ratiometric pericam. The sampling interval was 3-5s. (Top) Excitation ratios of 480 and 410 nm. The righthand ordinate indicates [Ca2+]i in µM with Rmax and Rmin indicated by an arrow and arrowhead, respectively. (Bottom) Excitations of 480nm (black line, left-hand scale) and 410nm (gray line, right-hand scale). Modified with permission from T. Nagai, A. Sawano, E. S. Park, and A. Miyawaki, Proc. Natl. Acad. Sci. U.S.A. 98, 3197 (2001). Copyright (2001) National Academy of Sciences, U.S.A. |
The following is a procedure for confocal imaging of [Ca2+]m in HeLa cells using the modified LSCM system.
- Plate HeLa cells or cells of interest onto a 35-mm glass-bottom dish with culture medium.
- Transfect the cells with 1µg per dish of cDNA encoding ratiometric pericam mitochondria using Lipofectin according to the manufacturer's instructions.
- Incubate the cells in a humidified atmosphere at 37°C under 5% CO2 for 1 to 3 days.
- Replace the culture medium with HBSS.
- Observe the cells on an inverted microscope (IX70, Olympus) for green fluorescence of the indicator (ratiometric pericam-mt) using a 490-nm excitation light generated using 490DF10.
- Choose moderately bright cells in which the fluorescence is well distributed in the mitochondria.
- Switch on the lasers, AOTF controller, scanning head, and the computer. The lasers need 30min to warm up and stabilize.
- Start the scanning process with only excitation from the 408-nm laser diode. Set the scan mode to "Normal (unidirectional)" and scan speed to "Fast." While looking at the acquired fluorescence images, adjust the laser intensity to the minimum level that allows easy identification of individual cells, adjust the sensitivity of the photomultiplier tube (PMT) for an optimal signal-to-noise ratio, and adjust the size of the pinhole for acceptable depth of the image. There is a trade-off between the scan speed and the pixel size: faster scanning speeds decrease resolution because fewer pixels of information are collected.
- Adjust the intensity of the 488-nm laser by setting the microscope to "Normal (unidirectional)" scan mode and "Fast" scan speed. While looking at the acquired fluorescence images, adjust the laser intensity to a minimum level that allows easy identification of individual cells and adjust the sensitivity of the PMT for an optimal signal-to-noise ratio and the size of the pinhole for acceptable depth of the image. Establishing the microscope settings described in steps 8 and 9 is a process that must be iterated to produce adequate ratio images.
- Start the control software for line-sequential dual-excitation ratio analysis. The "Normal" scan mode and "Fast" scan speed, with adequate pixel size, enable rapid exchange between the two lasers on a line every 5 to 20ms.
- Determine the desired scanning field (image size) and reduce the height of the image so that 5 to 10 frames can be obtained per second.
- Start to acquire images every 100 to 200ms for 1 to 5min.
- During image acquisition, add histamine solution to a final concentration of 10µM for receptor stimulation.
- Determine the image ratio by dividing the images acquired with excitation at 488nm by those acquired at 408 nm.
V. COMMENTS
A. pH and Photochromism as Practical Considerations
Ratiometric pericam is sensitive to changes in pH in both the presence and the absence of Ca2+ (Fig. 6). pHrelated artifacts were not an issue in experiments that used HeLa cells because agonist-induced [Ca2+]c mobilization did not induce any intracellular pH changes detectable by the pH indicator, BCECF (data not shown). However, ratiometric pericam expressed in dissociated hippocampal neurons was perturbed by acidification following depolarization or glutamate stimulation (data not shown).
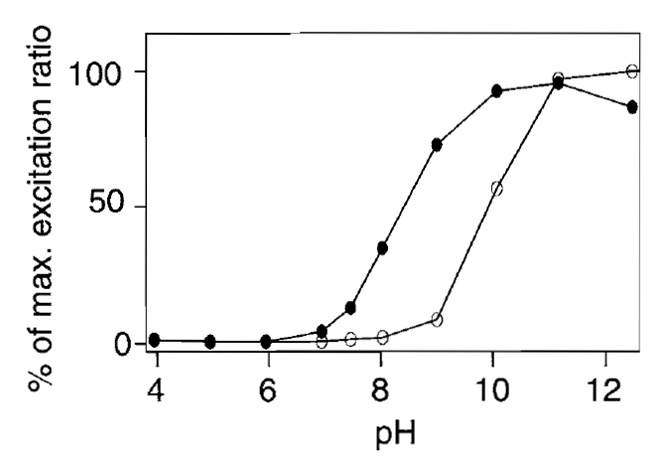 |
| FIGURE 6 pH dependency of the 495/410-nm excitation ratio in the presence ( |
B. Use of a High-Speed Grating Monochromator
Instead of a filter wheel containing 400DF15 and 485DF15 excitation filters, a fast wavelength exchanger based on a grating monochromator (U7773-XX and U7794-16, Hamamatsu Photonics) can be used with a fast-acquisition CCD camera (HiSCA, C6790-81, Hamamatsu Photonics). The spectrum of the excitation light when the wavelength was set at 410 or 490nm is shown in Fig. 7. Because light acquired with the setting at 490nm spills over into the observing optical path, it is preferable to eliminate the unwanted light by putting a short-pass filter like 500SP (Fig. 7, broken line) in front of the microscope.
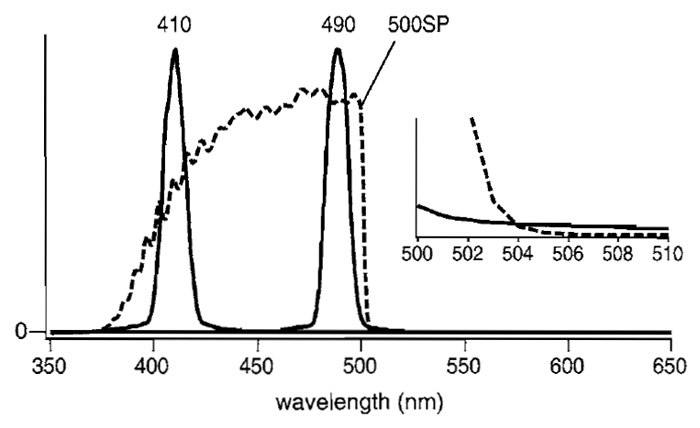 |
| FIGURE 7 Spectrum of the 410- or 490-nm light selected by the monochromator (U7773-XX and U7794-16, Hamamatsu Photonics) (solid line) and transmittance of a 500SP short-pass filter (Omega, 3rd Milenium) (broken line). (Inset) The crossing of the two curves for 490-nm light and 500SP on an expanded scale. |
When changes in [Ca2+]m are monitored by alternating the excitation wavelength automatically with wide-field conventional microscopy, the rate of acquisition of the excitation ratio is about 10 Hz, which is identical to the frame rate. Despite this rapid rate of data collection, the [Ca2+]m measurements are often affected adversely by the active motion of mitochondria, especially at warmer temperatures. Using our LSCM technique, we attempted to increase the speed of the alternation of excitation wavelengths so that it was faster than the movement of mitochondria. With this method, the frame rate was 5 Hz and the rate of ratio acquisition was 200 Hz. Although the frame rate did not allow us to fully follow the rapid movement of mitochondria, the fast rate of ratio acquisition minimized the time lag between the two measurements used to calculate the ratiometric signal. We feel that this method of imaging [Ca2+]m effectively corrects for mitochondrial movement in all three possible both laterally and into and out of the optical section. After the application of histamine, spots of [Ca2+]m increase within a single mitochondrion were identifiable (Fig. 8A) and the global increase in [Ca2+]m was found to occur relatively slowly (Fig. 8B).
![FIGURE 8 Confocal and dual-excitation imaging of [Ca2+]m using ratiometric pericam mitochondia. (A) Ratio images before and after application of 10µM histamine. Scale bar: 5µm. (B) Time course of averaged fluorescence signals from the white box in A with excitation at 488 (green) and 408 nm (violet) (top) and their ratio (bottom). The arrowhead indicates the time when histamine was applied.](images/v2_pb_s08_c41_f08.jpg) |
| FIGURE 8 Confocal and dual-excitation imaging of [Ca2+]m using ratiometric pericam mitochondia. (A) Ratio images before and after application of 10µM histamine. Scale bar: 5µm. (B) Time course of averaged fluorescence signals from the white box in A with excitation at 488 (green) and 408 nm (violet) (top) and their ratio (bottom). The arrowhead indicates the time when histamine was applied. |
Baird, G. S., Zacharias, D. A., and Tsien, R. Y. (1999). Circular permutation and receptor insertion within green fluorescent proteins. Proc. Natl. Acad. Sci. USA 96, 11241-11246.
Dickson, R. M., Cubitt, A. B., Tsien, R. Y., and Moerner, W. E. (1997). On/off blinking and switching behaviour of single molecules of green fluorescent protein. Nature 388, 355-358.
Miyawaki, A., Llopis, J., Heim, R., McCaffery, J. M., Adams, J. A., Ikura, M., and Tsien, R. Y. (1997). Fluorescent indicators for Ca2+ based on green fluorescent proteins and calmodulin. Nature 388, 882-887.
Nagai, T., Sawano, A., Park, E. S., and Miyawaki, A. (2001). Circularly permuted green fluorescent proteins engineered to sense Ca2+. Proc. Natl. Acad. Sci. USA 98, 3197-3202.
Robert, V., Gurlini, P., Tosello, V., Nagai, T., Miyawaki, A., Di Lisa, E, and Pozzan, T. (2001). Beat-to-beat oscillations of mitochondrial [Ca2+] in cardiac cells. EMBO J. 20, 4998-5007.
Shimozono, S., Fukano, T., Nagai, T., Kirino, Y., Mizuno, H., and Miyawaki, A. (2002). Confocal imaging of subcellular Ca2+ concentrations using a dual-excitation ratiometric indicator based on green fluorescent protein. Sci. STKE http://www.stke.org/cgi/ content / full / OC_sigtrans;2002 / 125 / p14.
Tsien, R. Y. (1998). The green fluorescent protein. Annu. Rev. Biochem. 67, 509-544.


