Three-Dimensional Cultures of Normal and Malignant Human Breast Epithelial Cells to Achieve in vivo-like Architecture & Function
Apicobasal polarity, properly positioned cell-cell contacts, and attachment to basement membrane are fundamental characteristics of simple glandular epithelia, such as the mammary gland. The development and maintenance of this polarized structure are essential for the formation of tissue architecture, control of proliferation, and the differentiated function of epithelial cells (Roskelley et al., 1995). Loss of architectural intactness and polarity is one of the pathological hallmarks of epithelial carcinoma (Bissell and Radisky, 2001). Although traditional studies of epithelial cells grown as a monolayer on tissue culture plastic remain a powerful tool to dissect and understand the molecular events of signaling machineries, tissue culture plastic does not recapitulate the microenvironment or morphology of glandular epithelium in vivo. Animal models have provided us with invaluable insights, which have led to a greater understanding of the events involved in mammary morphogenesis and tumorigensis in vivo, and aid in the translation from basic cellular research into clinical application. However, the complexity of animal model systems prevents us from precisely pinning down the specific biochemical and cell biological pathways involved in mammary morphogenesis and tumor formation. Therefore an in vitro cell-based model system that provides epithelial cells with an in vivo-like microenvironment, recapitulates both the three-dimensional (3D) organization and multicellular complexity, and is conducive to systematic experimental pertubation is optimal to bridge the gaps between epithelial monolayer cultures and animal models.
II. MATERIALS AND INSTRUMENTATION
Primary breast luminal cells from human reduction mammoplasty (Petersen et al., 1992) as well as human mammary epithelial cell lines have been successfully cultured utilizing the 3D BM assay. These include the following.
The HMT3522 progression series (Briand et al., 1987) consists of immortal human mammary epithelial cells originally isolated from fibrocystic breast tissue and includes the phenotypically normal S1 cells, as well as their tumorigenic derivative T4-2 cells, which were selected for their ability to grow in the absence of EGF (Briand et al., 1996; Weaver et al., 1996).
A. Culture Media Composition
Media for the HMT3522 progression series of human mammary epithelial cells are composed of DMEM/F12 media (GibcoBRL Cat. No. 12400-024) supplemented with insulin (Sigma Cat. No. 1-6634), human transferrin (Sigma Cat. No. T-2252), sodium selenite (Collaborative Research Cat. No. 40201), estradiol (Sigma Cat. No. E-2758), hydrocortisone (Sigma Cat. No. H-0888), prolactin (Sigma Cat. No. L-6520), and epidermal growth factor (EGF) (Roche Cat. No. 855731) as described in Briand et al. (1987) and Blaschke et al. (1994). Concentrations and stability are outlined in Table I.
 |
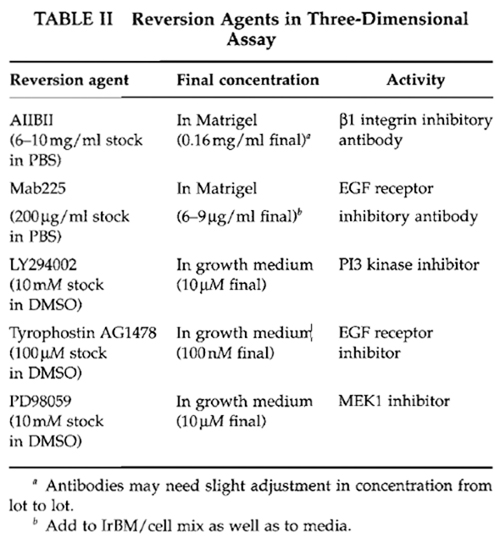
Vitrogen (collagen I, Cohesion Technologies) can be made from rat tail collagen, phosphate-buffered saline (PBS) (any vendor), 0.25% trypsin-EDTA (any vendor), soybean trypsin inhibitor (Sigma Cat. No. T6522), trypan blue (Sigma Cat. No. T8154), growth factor reduced Matrigel (Becton-Dickenson-Collaborative Research Cat. No. 354230), AIIB2, blocking antibody against 131 integrin (Sierra BioSource Inc. Cat. No. SB959), LY294002 (Cell Signaling Technologies Cat. No. 9901), Mab225 (Oncogene Research Cat. No. GR13L), PP2 (Calbiochem Cat. No. 529573), PD98059 (Calbiochem Cat. No. 513000) and tyrphostin AG1478 (Calbiochem Cat. No. 658552). All other equipment and supplies can be purchased from a variety of vendors.
C. Minimal Equipment Required for Cell Culture
Hemacytometer, low-speed centrifuge, inverted light microscope equipped with 4, 10, 20, and 40× objectives, pipetman p20, p200, pl000, pipette aid, biological safety cabinet, 37°C, 5% CO2 humidified culture incubator, air-tight plastic container, 37~ water bath.
D. General Tissue Culture Supplies
Tissue culture plasticware including T75 flasks, 4-, 6-, 24-, 48-, and 96-well dishes, 5-, 10-, and 25-ml individually wrapped sterile pipettes, 15- and 50-ml sterile conical centrifuge tubes, sterile 1- to 200- and 500- to 1000-µl pipette tips, and sterile 9-in. Pasteur pipettes and cell lifters.
Successful growth of these cells requires special attention to the media, confluency, trypsinization, and feeding regime in order to maintain healthy cells capable of undergoing differentiation. Insufficient attention to any of the aforementioned parameters will quickly result in cells acquiring a fibroblast-like morphology and concomitant failure to undergo 3D organization when cultured in IrBM.
A. Cell Maintenance
1. Preparation of Collagen-Coated Tissue Culture Flasks
- Make a working solution of collagen I [~65µg/ml] by the addition of 1 ml Vitrogen (collagen I) to 44 ml of cold l× PBS.
- Add 3ml of collagen solution for every 25-cm2 surface area of flask; tilt flask to make sure entire surface is coated.
- Store in an air-tight container, on even surface at 4°C, a minimum of overnight and a maximum of 3 weeks.
- Before use, aspirate liquid in the flask, wash once with 2ml DMEM/F12 per 25cm2 and add prewarmed growth media.
2. Passage of HMT3522 Cells
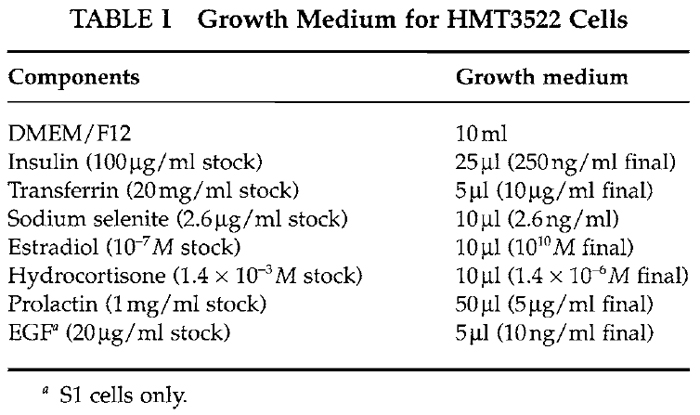
Change media every 2-3 days; it is important to ensure that fresh media be added 1 day before splitting. HMT3522 S1 cells should be passaged once the 2D colonies form rounded islands with the flask being approximately 75% confluent, as shown in Fig. 1A. This is usually occurs 8 to 10 days after the initial plating.
Passage HMT3522 T4-2 cells when the flask reaches 75% confluency, as shown in Fig. lB. This usually occurs 3 to 5 days after initial plating. Maintain T4-2 cells on Vitrogen (collagen I) or rat tail collagen-coated flasks.
 |
| FIGURE 1 The morphology of S1 and T4-2 cultured on tissue culture plastic. (A) S1 cells, passage 57, at day 10 after plating. The colonies are essentially round with smooth edges and with the inner cells somewhat compacted. Cells at the edge should take on a polar-like appearance indicated by the arrows. (B) T4-2, passage 37, at day 5 after plating. Cells are larger than $1, the colonies are irregular, and cells at the edges rarely show any organization. Bar: 25 µm. |
- Aspirate medium.
- Rinse cells in 0.5 to 1 ml of prewarmed 0.25% trypsin-EDTA for every 25 cm2 of surface area.
- Add 0.35ml of 0.25% trypsin for every 25 cm2 of surface area and cover cells by rotating the flask gently.
- Place flask in 37°C incubator for 3 min.
- Remove flask from incubator and check under the microscope to see if the cells have detached.
- If cells are still adherent, redistribute the trypsin and return the flask to the 37°C incubator for 1 min. Repeat until cells are detached.
- Once the majority of the cells are detached, knock the side of the flask gently; add -3 ml of prewarmed DMEM/F12 and 30µl of soybean trypsin inhibitor per 25 cm2.
- Gently pipette cells up and down three to five times to dissociate cell aggregates and transfer to a 15-ml conical centrifuge tube.
- Pellet the cells by spinning at ~115g for 5 min.
- Aspirate media and resuspend the cell pellets in their appropriate growth media (~3.25 ml per 25 cm2 of surface area of their original flask).
- Determine the cell concentration by removing a 95-µl aliquot and placing into a 1.5-ml Eppendorf tube, add 5µl of 0.4% trypan blue, mix gently with a pipetman, load onto a hemacytometer, count on an inverted microscope, and determine the number of viable (nonblue) cells per milliliter.
- Plate
- HMT 3522 S1 cells at a density of 2 × 10⁴ cells/cm2 on tissue culture plastic.
- HMT 3522 T4-2 cells at a density of 1 × 10⁴ cells/cm2 on collagen I-coated flasks.
3. Three-Dimensional BM Assay Embedded in I rBM/EHS/(Ma trige 1)
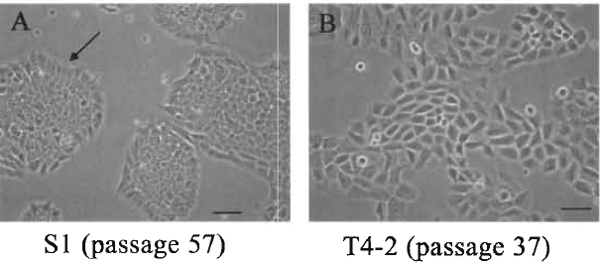
Single phenotypically normal mammary epithelial cells embedded into lrBM will undergo several rounds of cell division, withdraw from cell cycle between 6 and 8 days (depending on the cell type), organize into polarized structures, and form acini-like structures, including a central lumen. Malignant cells, however, continue to proliferate and form disorganized, tumorlike structures (Fig. 2). Starting on day 4 but clearly by day 10, one can distinguish nonmalignant from malignant cells. Immunohistochemistry analysis for the Ki67 antigen on day 10 shows that ~60% of the malignant cells are still proliferating, whereas only <10% of the nonmalignant remain in the cell cycle.
 |
| FIGURE 2 Morphology, size, and proliferation rate of S1 and T4-2 and T4-2 reverted cells embedded in 3D BM. (A) Schematic representations of the morphology of S1, T4-2, and T4-2 cells treated with signaling inhibitors as a function of time. (B) The percentage of Ki67 positive cells for S1, T4-2, and T4-2 cells treated with tyrophostin AG1478 from days 2 to 10. (C) The number of cells/acini for S1, T4-2, and T4-2 cells treated with tyrophostin AG1478 from days 2 to 10. |
The following volumes and concentrations given are appropriate for a 35-mm tissue culture dish (9.6- cm2 surface area). The volumes and concentrations must be adjusted to correct for the area of the plate used in the analysis. IrBM should be stored at -80°C. Thaw immersed in ice at 4°C overnight before use. Once thawed it should not be refrozen but can be kept in ice at 4°C for more than 1 month. Matrigel lots are tested before use and batches are purchased for experimental use. Alternatively, the basement membrane mixture (EHS) can be made from the Engelbreth-Holm-Swarm mouse tumor described in Kleinman et al. (1982); see Section III,B details.
Note: EHS or Matrigel should always be kept on ice as it will polymerize quickly at room temperature.
- Chill plates on ice inside a tissue culture hood.
- Add 120µl of EHS per 35-mm dish spread in the center of the dish without introducing bubbles, spread EHS evenly across the surface of the dish using a sterile cell lifter or the back of a sterile pipette tip (make sure the entire surface is covered, including the edges), and place in a 37°C incubator for a minimum of 15 min to allow the EHS to polymerize. (Do not let sit more than 1h in incubator as it will begin to dry out.)
- While the EHS is polymerizing, trypinsize and count the cells as described earlier.
- Place an aliquot containing the appropriate number of cells into a sterile centrifuge tube: 1.0 × 10⁶ cells S1 (and other nontumorgenic cell lines) and 0.7× 10⁶ cells T4-2 (and other tumorgenic cell lines).
- Centrifuge for 5 min at ~115g to pellet the cells, aspirate media, and resuspend the pellet by flicking the tube.
- Place the cell pellet on ice, add 1.2ml EHS, and carefully pipette mixture up and down to distribute cells evenly but not introduce bubbles into the EHS.
- Transfer to a precoated 35-mm dish.
- Place in 37°C incubator for ~30 min until the EHS is polymerized.
- Once a gel is formed, add 1.5 to 2.0ml of the appropriate media to the dish.
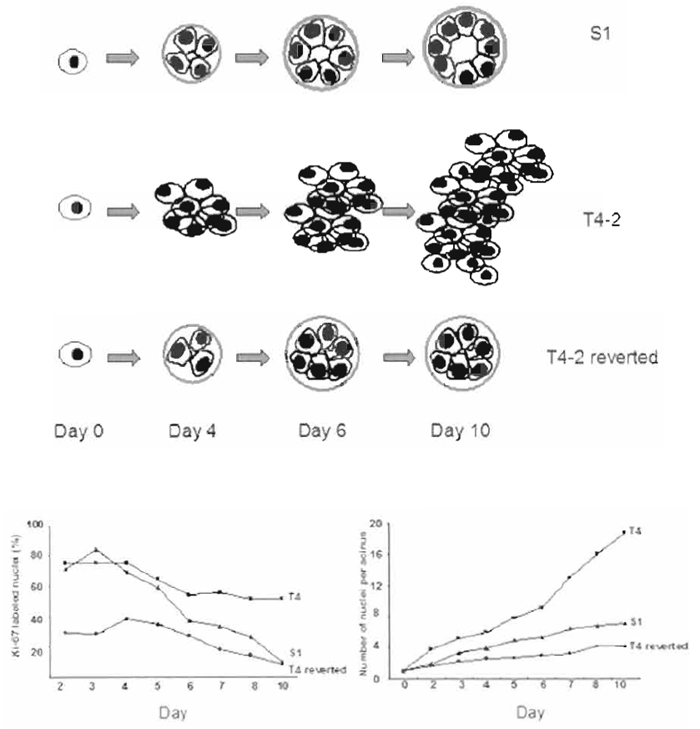
- Culture the cells for 10 days, changing media every 2 to 3 days. Figures 3A-3D show cells cultured in Matrigel for 10 days.
The culture of mammary epithelial cells, developed previously in our laboratory for functional studies of mouse cells (Barcellos-Hoff et al., 1989; Roskelley et al., 1994), has now been adopted to human cells as well. Making 3D BM cultures on top of EHS as opposed to inside the gel has some advantages and a few drawbacks. The proliferation and morphological differences between nonmalignant and malignant cells can be distinguished by 4 days in culture as opposed to the 8-10 days required for embedded cultures. The cell colonies can readily be imaged utilizing a live cell imager, allowing one to follow a single cell to an acini-like structure. Furthermore, cell colonies can be harvested easily by scraping the culture gently with a pipette tip and depositing the isolate on a glass slide for analysis by immunohistochemistry. The advantage of this method of harvest is that the remaining culture can be harvested for DNA, RNA, or protein. However, neither the morphology nor the growth rate of the acini is as tightly controlled as the embedded cultures. An additional disadvantage of the on-top culture is that the amount of material collected per plate is less than the embedded cultures, as plating of the cells is restricted to one plane. Therefore, there are significantly less cells per millimeter dish to be harvested compared to the embedded assay. The following volumes and concentrations are appropriate for a 35-mm tissue culture dish (9.6-cm2 surface area). The volumes and concentrations must be adjusted to correct for the area of the plate used in the analysis.
- Chill plates on ice in a tissue culture hood.
- Add 0.5 ml to the center of the dish and spread EHS evenly without creating bubbles as described earlier.
- Place in 37°C incubator for ~30min until the EHS is polymerized.
- Trypsinize cells as described previously.
- Place an aliquot containing the appropriate number of cells into a sterile centrifuge tube: 0.3 × 10⁶ cells S1 (and other nontumorgenic cell lines) and 0.2× 10⁶ cells T4-2 (and other tumorgenic cell lines).
- Centrifuge for 5 min at ~115g to pellet the cells, aspirate media, and resuspend the pellet by flicking the tube.
- Resuspend the cells in half of the total volume of the appropriate media for the cells (1 ml for 35mm) according to the size of the plate (see later).
- Plate the cells on top of the polymerized EHScoated dishes, let sit in hood for 5 min, and then check under a microscope to see if cells are distributed evenly. If not, move plate on a flat surface, back to front and then side to side, to distribute and let sit for 5 min.
- Return plates to the incubator for-30min until the cells have adhered.
- Prepare media plus 10% EHS on ice.
- Add the appropriate amount of media with 10% EHS to the cells to achieve a final concentration of 5% EHS.
- Culture the cells for 4-6 days, changing media every 2-3 days.
 |
| FIGURE 3 Morphologies of $1 (A), T4-2 (B), 184B5 (C), and MCF10 (D) cells embedded in 3D BM (all cells were cultured in Matrigel for 10 days) and S1 (E) and T4-2 (F) cells cultured on top (cells were cultured on top of Matrigel for 4 days). Photographs were taken using a phase-contrast microscope. Bar: 25 µm. |
The reversion assay can determine the ability of tumor cells to become phenotypically normal or to undergo apoptosis as a function of treatments. In addition, the differential response of tumorigenic and nonmalignant cells to a wide variety of perturbations can be analyzed. Analyses can be performed both on cells cultured embedded in or on top of EHS. This assay can be used as a screen for potential therapeutics by manipulating various genes, signaling pathways, and/or protein modifications and for determining their role in the establishment or maintenance of the tumorigenic phenotype. Cancer cells, cultured as described earlier, can be treated with a wide variety of agents, including inhibitory or stimulatory antibodies to integrins or growth factor receptors, small molecule inhibitors to different signaling pathways, gene delivery via transfection with expression vectors or transduction with virus overexpressing genes of interest, and RNAi for specific gene silencing.
Quantitative end points include morphology, proliferation index, degree of polarity, and level of expression of genes of interest using RT-PCR, Northern, or Western analysis, as well as immunofluorescence. Table II details a variety of molecules that have been shown to revert T4-2 cells. A typical reversion morphology of T4-2 cells is illustrated in Fig. 4.
 |
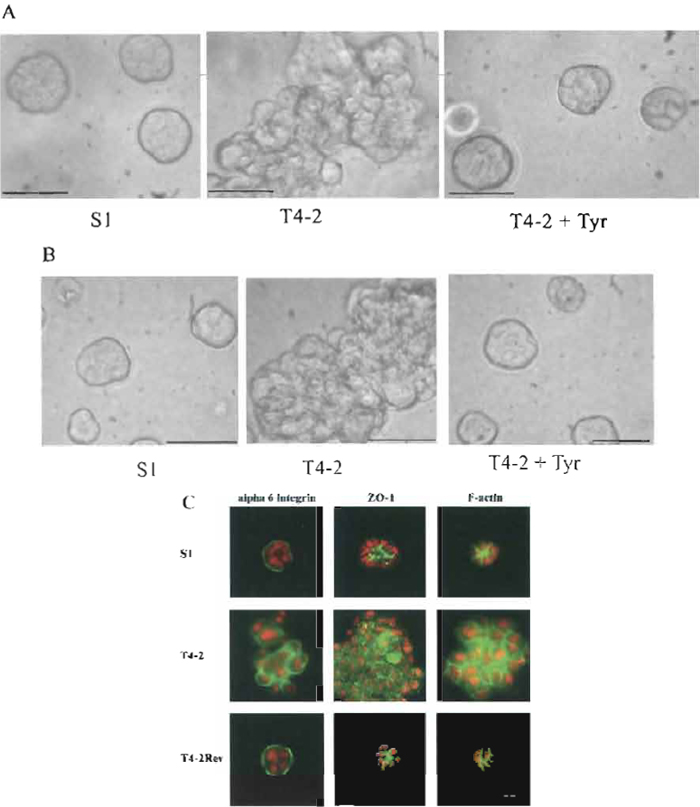 |
| FIGURE 4 Morphological and immunofluorescence analyses of S1, T4-2, and T4-2 treated with LY 294002 or tyrphostin AG1478. (A) Cells were embedded in Matrigel and cultured for 10 days. (B) Cells were cultured for 4 days on top of Matrigel. S1, T4-2, and T4-2Rev cells were treated with 0.1 mM AG1478 tyrphostin. Photographs were taken using a phase-contrast microscope. A & B Bars: 25 mm. (C) Structures isolated from 3D BM after 10 days in culture were stained with the basal marker α6- integrin, the apical marker ZO-1, and the cytoplasmic marker F-actin. S1, T4-2, and T4-2Rev cells were treated with 10mM LY 294002. Photographs were taken using a fluorescence microscope. Bars: 10mm. |
For molecular analysis of cell extracts, it is important to remove them from the gel. Apart from scraping the colonies as described earlier, which will still have minor EHS contamination, intact cellular structures can be released from EHS utilizing chelating agents, a procedure described in Weaver et al. (1997). A modified version is described here. Note that the solutions must be cold and the cells kept on ice for the entire harvest period. The maximum harvest should be 1 h as the cell-cell junctions will begin to come apart if left in these solutions for too long.
Perform the following steps on the day of harvest.
- Wash cultures twice with cold PBS without Ca2+ or Mg2+ plus 0.005 M EDTA.
- Scrape cultures into 3 ml cold PBS without Ca2+ or Mg2+ plus 0.005 M EDTA/25-cm2 surface area, transfer into an appropriate size centrifuge tube, wash the plates twice with 3 ml each cold PBS, and bring final volume to 10 ml.
- Incubate cells on ice for ~45 min, gently inverting the tube two or three times every 10 min.
- Cell release from 3D BM is complete when the cellular structures begin to settle at the bottom of the centrifuge tube and the supernatant does not contain floating gel or flocculent substances.
- Centrifuge gently for 2-4min at 115g until a loose pellet is obtained (the cells are very fragile at this point; therefore, centrifuging too hard or long will result in cell lysis).
- Aspirate the supernatant, leaving a very small amount of liquid above the pellet.
- For immunohistochemistry or immunofluorescence, smear a small aliquot gently across a small area of a glass slide and fix, using the appropriate fixative for antibody of interest and store at- 20°C until use.
- For RNA isolation, lyse an aliquot in lysis buffer of choice and store at -80°C.
- For Western or immunoprecipitation analyses, lyse aliquots in appropriate buffer and store at -80°C.
B. Additional Procedures
1. Criteria for Purchase of Appropriate Matrigel Lots
Test lots of Matrigel and choose those that are low in epidermal growth factor (EGF), low endotoxin, which have a protein concentration close to 10mg/ ml.
Test the cells of interest by always comparing old and new lots side by side using the 3D BM-embedded and on top culture conditions as described earlier. Also test the ability of malignant cells of interest to revert in the presence of tyrphostin AG1478 or known reverting agents.
- On the final day of culture measure the colony sizes using an inverted microscope equipped with an eyepiece reticule. Eighty percent or greater of the colonies should be within the following diameters: 24 µm S1, >74 µm T4-2, and 25-32 µm T4rev.
- Isolate colonies from the 3D BM as described previously to determine:
- by immunofluorescence
- cell proliferation index by determining the percentage of positive Ki67 cells
- degree of polarity by localization of molecules such as α6-integrin, E-cadherin, and cortical actin.
- by Western blot (for S1 and T4-2)
- relative levels of β1 integrin
- relative levels of EGF receptor
- by immunofluorescence
The EHS tumor is grown in C57 black mice. Typical propagation of the tumor starts with one-third of a fresh tumor, which is enough to inject 10 mice. The tumor sample is minced with a scalpel blade sussuspended into 2 ml PBS and is then further disassociated by pushing it through an 18-gauge needle followed by a 20-gauge needle. This tumor slurry is then injected intramuscularly (IM) into the hind limb (0.2ml/limb) of mice. Tumors are allowed to grow for 4 weeks. For the last 2 weeks of tumor growth, 0.1% β-aminopropionitrile fumarate (BAPN) is added to the drinking water to prevent the collagen from cross-linking. The tumors should be harvested, weighed, frozen in liquid nitrogen, and stored at-80°C until use. For further information, see Kleinman et al. (1986).
The following buffers are needed for isolation.
Buffer 1: 3.4M NaCl, 50mM Tris-Cl, pH 7.4, 4mM EDTA, and 2mM N-ethylmalenmide (NEM) (make up 100× stock in H2O fresh for each other preparation)
Buffer 2: 0.2M NaCl, 50mM Tris-Cl, pH 7.4, 4rmM EDTA, 2mM NEM (make up 100× stock in H2O fresh for each preparation), and 2M urea, ultrapure or deionized
Buffer 3: 0.15M NaCl, 50mM Tris-Cl, pH 7.4, 4mM EDTA, and 2 mM NEM (make up 100× stock in H2O fresh for each preparation). Sterilize
- Distribute 10-15 g of frozen tumor tissue (stored previously at -80°C) into two 50-ml tubes.
- Add approximately 2ml buffer 1 for each gram of tissue and homogenize (add more buffer as needed until all tissue is homogenized evenly).
- Transfer homogenate to an appropriate ultracentrifuge tubes, balance tubes using buffer 1, and spin for 20min at 4°C at 83472 RCF (ave) (corresponds to 26,000rpm when using a SW 41 rotor).
- Decant supernantant, add 1-2ml fresh buffer 1, rehomogenize, transfer to fresh ultracentrifuge tubes, balance with buffer 1, and spin again as just described; repeat these steps so that the tissue has been homogenized and spun for a total of three times.
- Resuspend the pellet in buffer 2 as follows: add 1 ml/tube, homogenize briefly to get pellet into suspension, add buffer 2 until equivalent to 1.8ml/g of original tumor weight, transfer suspension into a beaker with a stir bar, cover well, and stir overnight in a cold room.
- Transfer liquid to ultracentrifuge tubes and spin as described earlier (try to add the minimum amount of additional buffer to balance). Save the supernantant.
- Load supernatant into medium-sized dialysis tubing. Dialyze in cold room against 1 liter of buffer 3 for 1.5 to 2 days with three changes of buffer.
- Dialyze in cold room against the media of choice for 3h.
- Store on ice in thermos at 4°C if used within 2 months. Otherwise, freeze aliquots at -80°C and thaw on ice before use.
IV. COMMENTS
Using this assay system, one can screen a wide variety of breast tumor cell lines and assess their ability to revert or die when treated with various signaling inhibitors and/or potential therapeutics, as outlined in Wang et al. (2002).
V. PITFALLS
- Use healthy cells that are no more than 75% confluent.
- Make sure the cells have been dispersed into single cells and that you do not introduce bubbles into the lrBM for 3D BM-embedded cultures. Cell clumps will make it hard to interpret morphological characteristics at the end of the assay.
- Feed cells every 2-3 days with fresh media when appropriate, include test compound.
Acknowledgments
Work from the authors' laboratory was supported by the United States Department of Energy, Office of Biological and Environmental Research (DE-AC03 SF0098 to M.J.B.). Additional funding was contributed by the Department of Defense Breast Cancer Research Program (#DAMD17-02-1-0438 to M.J.B.) and the National Cancer Institute (CA64786-02 to M.J.B., and CA57621 to Zena Werb and M.J.B). The authors thank Paraic Kenny for editorial comments.
References
Barcellos-Hoff, M. H., Aggeler, J., Ram, T. G., and Bissell, M. J. (1989). Functional differentiation and alveolar morphogenesis of primary mammary cultures on reconstituted basement membrane. Development 105, 223-235.
Bissell, M. J., and Radisky, D. (2001). Putting tumours in context. Nature Rev. Cancer 1, 46-54.
Bissell, M. J., Weaver, V. M., Lelievre, S. A., Wang, E, Petersen, O. W., and Schmeichel, K. L. (1999). Tissue structure, nuclear organization, and gene expression in normal and malignant breast. Cancer Res. 59, 1757-1763s; discussion 1763s-1764s.
Blaschke, R. J., Howlett, A. R., Desprez, P. Y., Petersen, O. W., and Bissell, M. J. (1994). Cell differentiation by extracellular matrix components. Methods Enzymol. 245, 535-556.
Briand, P., Nielsen, K. V., Madsen, M. W., and Petersen, O. W. (1996). Trisomy 7p and malignant transformation of human breast epithelial cells following epidermal growth factor withdrawal. Cancer Res. 56, 2039-2044.
Debnath, J., Mills, K. R., Collins, N. L., Reginato, M. J., Muthuswamy, S. K., and Brugge, J. S. (2002). The role of apoptosis in creating and maintaining luminal space within normal and oncogeneexpressing mammary acini. Cell 111, 29-40.
Gudjonsson, T., Ronnov-Jessen, L., Villadsen, R., Bissell, M. J., and Petersen, O. W. (2003). To create the correct microenvironment: Three-dimensional heterotypic collagen assays for human breast epithelial morphogenesis and neoplasia. Methods 30, 247-255.
Howlett, A. R., Petersen, O. W., Steeg, P. S., and Bissell, M. J. (1994). A novel function for the nm23-H1 gene: Overexpression in human breast carcinoma cells leads to the formation of basement membrane and growth arrest. J. Natl. Cancer Inst. 86, 1838-1844.
Kleinman, H. K., Graf, J., Iwamoto, Y., Kitten, G. T., Ogle, R. C., Sasaki, M., Yamada, Y., Martin, G. R., and Luckenbill-Edds, L. (1987). Role of basement membranes in cell differentiation. Ann. N. Y. Acad. Sci. 513, 134-145.
Kleinman, H. K., McGarvey, M. L., Hassell, J. R., Star, V. L., Cannon, E B., Laurie, G. W., and Martin, G. R. (1986). Basement membrane complexes with biological activity. Biochemistry 25, 312-318.
Kleinman, H. K., McGarvey, M. L., Liotta, L. A., Robey, P. G., Tryggvason, K., and Martin, G. R. (1982). Isolation and characterization of type IV procollagen, laminin, and heparan sulfate proteoglycan from the EHS sarcoma. Biochemistry 21, 6188-6193.
Orkin, R. W., Gehron, P., McGoodwin, E. B., Martin, G. R., Valentine, T., and Swarm, R. (1977). A murine tumor producing a matrix of basement membrane. J. Exp. Med. 145, 204-220.
Petersen, O. W., Ronnov-Jessen, L., Howlett, A. R., and Bissell, M. J. (1992). Interaction with basement membrane serves to rapidly distinguish growth and differentiation pattern of normal and malignant human breast epithelial cells. Proc. Natl. Acad. Sci. USA 89, 9064-9068.
Roskelley, C. D., Desprez, P. Y., and Bissell, M. J. (1994). Extracellular matrix-dependent tissue-specific gene expression in mammary epithelial cells requires both physical and biochemical signal transduction. Proc. Natl. Acad. Sci. USA 91, 12378-12382.
Roskelley, C. D., Srebrow, A., and Bissell, M. J. (1995). A hierarchy of ECM-mediated signalling regulates tissue-specific gene expression. Curr. Opin. Cell Biol. 7, 736-747. Schmeichel, K. L., and Bissell, M. J. (2003). Modeling tissue-specific signaling and organ function in three dimensions. J. Cell Sci. 116, 2377-2388.
Soule, H. D., Maloney, T. M., Wolman, S. R., Peterson, W. D., Jr., Brenz, R., McGrath, C. M., Russo, J., Pauley, R. J., Jones, R. E, and Brooks, S. C. (1990). Isolation and characterization of a spontaneously immortalized human breast epithelial cell line, MCF-10. Cancer Res. 50, 6075-6086.
Walen, K. H., and Stampfer, M. R. (1989). Chromosome analyses of human mammary epithelial cells at stages of chemical-induced transformation progression to immortality. Cancer Genet. Cytogenet. 37, 249-261.
Wang, F., Hansen, R. K., Radisky, D., Yoneda, T., Barcellos-Hoff, M. H., Petersen, O. W., Turley, E. A., and Bissell, M. J. (2002). Phenotypic reversion or death of cancer cells by altering signaling pathways in three-dimensional contexts. J. Natl. Cancer Inst. 94, 1494-1503.
Wang, E, Weaver, V. M., Petersen, O. W., Larabell, C. A., Dedhar, S., Briand, P., Lupu, R., and Bissell, M. J. (1998). Reciprocal interactions between betal-integrin and epidermal growth factor receptor in three-dimensional basement membrane breast cultures: A different perspective in epithelial biology. Proc. Natl. Acad. Sci. USA 95, 14821-14826.
Weaver, V. M., Fischer, A. H., Peterson, O. W., and Bissell, M. J. (1996). The importance of the microenvironment in breast cancer progression: Recapitulation of mammary tumorigenesis using a unique human mammary epithelial cell model and a threedimensional culture assay. Biochem. Cell Biol. 74, 833-851.
Weaver, V. M., Lelievre, S., Lakins, J. N., Chrenek, M. A., Jones, J. C., Giancotti, E, Werb, Z., and Bissell, M. J. (2002). beta4 integrindependent formation of polarized three-dimensional architecture confers resistance to apoptosis in normal and malignant mammary epithelium. Cancer Cell 2, 205-216.
Weaver, V. M., Petersen, O. W., Wang, E, Larabell, C. A., Briand, P., Damsky, C., and Bissell, M. J. (1997). Reversion of the malignant phenotype of human breast cells in three-dimensional culture and in vivo by integrin blocking antibodies. J. Cell Biol. 137, 231-245.
Support our developers


