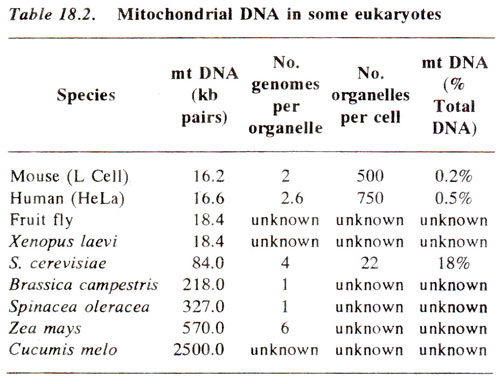
We know that like the chloroplasts, the mitochondria of both animals and plants also contain DNA. But unlike chloroplast genome mitochondrial genome (mtDNA) shows fairly large range of variation in size and in its proportion in .the cellular DNA. It varies in size from 15-19 kb in diptera, mammals, amphibians and fishes; from 15-176 kb in protists and fungi; from 200-2400 kb in higher plants. However, the number of mitochondria per cell is large, although relative to the nuclear DNA, usually the mtDNA still represents only about less than 1 % of cellular DNA, except in yeast (
Saccharomyces cerevisiae)
. In yeast, mtDNA may represent as high as 18% of the cellular DNA, each mitochondrial genome being 85 kb. Some details of mtDNA are shown in Table 18.2.
Mitochondrial DNA, like chloroplast DNA is usually circular, but in cilitate protozoans,
Chlamydomonas reinhardii, and also in some yeasts, the mitochondrial DNA is a linear molecule. The genetic role of this DNA (mtDNA) is also understood now. The most important work on mitochondria was done in yeast which was initiated by the discovery of petite mutants by
B. Ephrussi. Subsequently mtDNA was studied in several organisms including plants and human beings.
'Petite' in yeast, a mitochondrial character. The
petite mutants in yeast fail to grow on carbon source like glucose and produce smaller colonies when grown on sugars like glucose. This is a difference which can be observed only in the presence of oxygen, so that these petites actually have a defective aerobic respiratory mechanism. These
petites differ from wild type, called
grande and are characterized by (i) their insensitivity to inhibitors of aerobic pathways (like cyanide), (ii) absence of cytochromes a, a
3, b and a number of other changes in mitochondrial respiratory enzymes, (iii) incompletely developed state of mitochondria and (iv) lack of stainability of petite mitochondria.
The petite mutants can be
‘segregational’ following Mendelian segregation and, therefore, presumably controlled by chromosomal genes or may be more often
‘vegetative’ (non-segregational) or extra-chromosomal. The genetic basis of petite character is a cytoplasmic factor ρ
+ (rho), which may be absent or defective in petites. The vegetative petites, thus can be neutral (ρ
0), which completely lack ρ
+ or they can be suppressive (ρ
-) having a defective ρ
+. The neutral petites are not transmitted while suppressive petites are transmitted to a fraction of vegetative diploid progeny. Suppressiveness varies from 1-99% petites in various strains.
Two lines of evidences suggest association of ρ
+ with mitochondrial DNA (mtDNA).
- Ethidium bromide, which induces petite mutations with 100% efficiency, causes degradation of mtDNA after prolonged exposure of cells. Neutral petites have actually been found to lack mtDNA.
- Suppressive petites contain mtDNA, that is often grossly altered in base composition with respect to wild mtDNA.
Poky Neurospora, a mitochondrial character. A
poky mutant in
Neurospora differs from wild type in the following attributes : (i) it is slow growing, (ii) it shows maternal inheritance and (iii) it has abnormal cytochromes (cytochromes are proteins needed for oxidation of food and generation of ATP energy). Of the three cytochromes, cyt a, b and c found in wild type, cyt a and b are absent and cyt c is in excess in poky mutant. In reciprocal crosses, poky character shows maternal inheritance (poky ♀ x wild type ♂ → all poky; wild type ♀ x poky ♂→ all wild type), although other marker nuclear genes (e.g.
ad+/ad-)show 1 : 1 segregation. Following evidences suggested that poky may be located in mitochondrial genome : (i) slow growth may be due to lack of ATP energy and source of this energy is mitochondria; (ii) cytochromes in poky differ from those in wild type in quality and quantity and these cytochromes are found in mitochondria.
Mapping of mitochondrial genes in yeast.
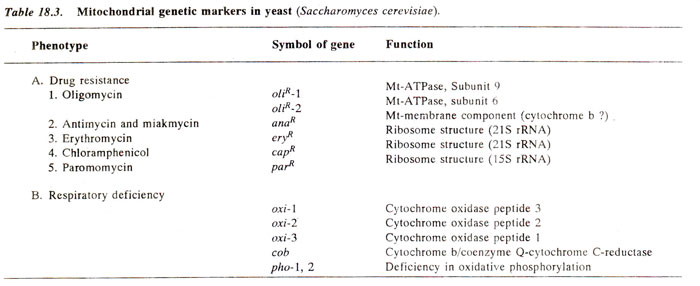
The mitochondrial genes in yeast (Table 18.3) have been mapped using a variety of techniques, some of them similar to those used for chloroplast genes. These techniques have been extended for mapping mitochondrial genes in other organisms also and will be briefly described.
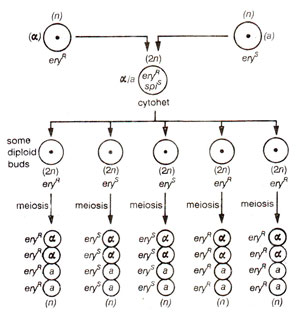
Fig. 18.26. Non-Mendelian inheritance of erythromycin resistance (eryR))in yeast (alleles a and α representing mating types segregate in a Mendelian fashion).

Fig. 18.27. Non-Mendelian inheritance (from the cross eryR spiR x eryS spiS in yeast;(spiR = spiramycin resistance); note the cytoplasmic segregation and recombination (CSAR) at the diploid level and lack of segregation during meiosis.
(a) Recombination mapping. Since there are no chloroplasts in yeast, all genes showing uniparental inheritance can be attributed to mitochondria. Uniparental inheritance can be established, when two mating types (
Mat a and
Mat a)are fused, the fusion product being a diploid (
2n) and also a
cytohet (cytoplasmically heterozygous). If diploid cells are allowed to divide mitotically (budding), segregation and recombination occur, but when this budding is followed by meiosis (meiosis can be induced by shifting cells into a special medium), all ascospores in an ascus are one type with respect to mitochondrial genes, although they show segregation (1:1) for nuclear genes including the gene for mating type. This is illustrated in Figure 18.26 using a cross
eryR x eryS (erythromycin resistant x erythromycin susceptible).

Fig. 18.26. Non-Mendelian inheritance of erythromycin resistance (eryR))in yeast (alleles a and α representing mating types segregate in a Mendelian fashion).

Fig. 18.27. Non-Mendelian inheritance (from the cross eryR spiR x eryS spiS in yeast;(spiR = spiramycin resistance); note the cytoplasmic segregation and recombination (CSAR) at the diploid level and lack of segregation during meiosis.
Using the above principle, if a dihybrid cross such as
eryR spiR x
eryS spiS (
spi - spiromycin) is made and diploid cells are allowed budding followed by sporulation (meiosis), all asci showed lack of segregation (Fig. 18.27) and the results like the following could be obtained :
eryR spiR = 63 tetrads;
eryS spiS = 48 tetrads;
eryS spiR= 7 tetrads;
eryR spiS = 1 tetrad. Among these four, two classes are recombinants, but they result from several rounds of recombination during budding as in phages. Recombination is also influenced by a genetic factor,
omega (ω), not found in all yeast strains. Nevertheless recombination data like the above have been utilized for mapping, recombination generally never exceeding 25% as against 50% for nuclear genes.
(b) Mapping by petite analysis. In the above technique, petite character is artificially induced in wild type (also called grande) carrying severalmitochondrial marker genes, e.g.
eryR capR oliR spiR. The petites so induced are screened for retention or loss of these mitochondrial genes. The petites can not be tested directly for drug resistance and therefore are first rescued by fusion with drug susceptible grande cells, so that if on budding some of the fused
2n cells are drug resistant,.this would mean that petite was resistant (Fig. 18.27). If frequencies of genes, which are retained or lost together, are compared, this would give an idea about the strength of linkage.
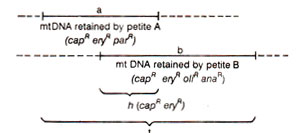
Fig. 18.28. Measurement of overlap between two petite mtDNAs in yeast (see text for details).

Fig. 18.29. Placement of markers on genetic map using overlapping segments in two petite mtDNAs (shown in Figure 18.28) in yeast.
(c) Overlapping of mtDNA segments in petites.In the above analysis, petites can be identified, which retain different sets of mt-genes. For instance, suppose petite A retains
capR eryR parR and petite B retains
capR eryR oliR anaR. Now, DNA can be extracted separately from A and B, and hybridized with DNA from wild (grande) type cells. Suppose amount of DNA hybr idized is
a units with petite A,
b units with petite B and
t units with A + B together. Now if
t is less than
a +
b, then there must be an overlap (
h)
= (
a + b)-
t (Fig. 18.28). In this overlap region
h, must be found genes retained both in petite A and petite B. (
capR eryR in this case). The overlap
h should also represent the maximum distance between
capR and
eryR. This will allow placement of markers into map segments of defined size (Fig. 18.29). A library of petites is thus now available with various genes retained, and different petites related due to specific overlap regions.

Fig. 18.28. Measurement of overlap between two petite mtDNAs in yeast (see text for details).

Fig. 18.29. Placement of markers on genetic map using overlapping segments in two petite mtDNAs (shown in Figure 18.28) in yeast.
An interesting feature of petites is that the amount of mtDNA in petite and grande is almost equal. This is due to amplification of a small DNA segment which is retained in petite (Fig. 18.30). This equality of DNA does not interfere with the technique of ‘overlapping mtDNA segment’ utilized for genetic mapping.

Fig. 18.30. Deletion and amplification of mtDNA, leading to production of two different petites in yeast.
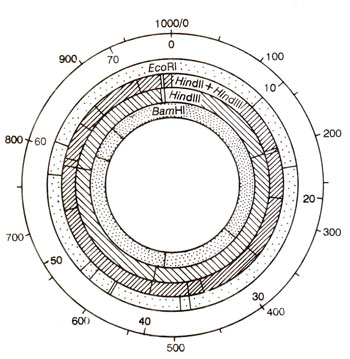
Fig. 18.31. A restriction map of yeast mtDNA (figures in outermost circle represent kilobase pairs of DNA; inner four circle show restriction site for four enzyme combinations).
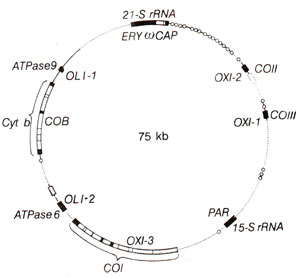
Fig. 18.32. Maps of circular yeast (Saccharomyccs cerevisiae)and human mitochondrial DNAs. Both the gene products and gene symbols are shown. Black boxes show regions of mRNA or rRNA synthesis. Small circles are regions of tRNA synthesis.
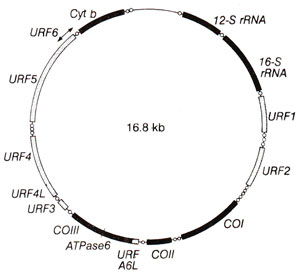
Fig. 18.33. Map of human mitochondrial DNA.
(d) Mapping by restriction enzyme analysis. Restriction fragment analysis has also been utilized for mapping as has been done for chloroplasts also. Utilizing the technique of restriction mapping to be described in
Genetic Engineering and Biotechnology 2. Restriction Maps and Molecular Genetic Maps, restriction maps of mtDNA can be prepared (Fig. 18.31). The tRNAs, rRNAs and other RNAs can be hybridized with restriction fragments to identify mtDNA fragments carrying the genes. The limits of these fragments can be narrowed using fragments produced by different restriction enzymes separately, for hybridization with the same RNA.
Restriction mapping may also be combined with techniques of 'petite analysis' and 'overlapping DNA segments' described above. This allows us to locate physically the genes for drug resistance (e.g.
eryR, capR, etc.), on specific restriction fragments.
The circular genetic map of yeast prepared following above techniques is presented in Figure 18.32. The genetic map of human mitochondria is show in Figure 18.33.

Fig. 18.32. Maps of circular yeast (Saccharomyccs cerevisiae)and human mitochondrial DNAs. Both the gene products and gene symbols are shown. Black boxes show regions of mRNA or rRNA synthesis. Small circles are regions of tRNA synthesis.

Fig. 18.33. Map of human mitochondrial DNA.
Human mtDNA. In human beings, mt-DNA is smaller in size (1.66 kilobases) and the complete nucleotide sequence of this DNA is now known.
From the sequence, without any genetic analysis, 13 genes for different polypeptides, genes for two species of rRNA and those for a complete set of tRNA molecules could be identified. This is a remarkable example of complete genetic map obtained without any genetic analysis (Fig. 18.33).
Plant mtDNA. In maize, cytoplasmic male sterility is determined by mtDNA, which has already been discussed in detail earlier, while discussing male sterility in this section. The structure of mtDNA in several flowering plants is under investigation now. It seems that in plants, mtDNA molecules of variable size are available, making the study relatively difficult.
A Comparison of mtDNA in yeast and mammals. We have seen that the mitochondrial
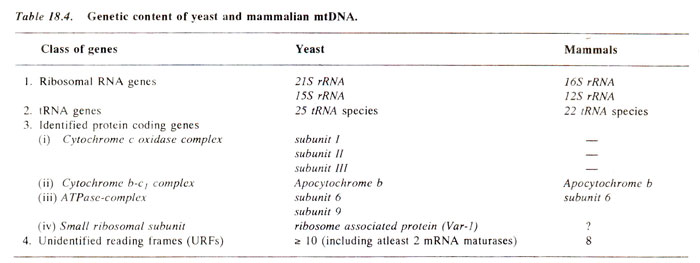
DNA of only a few individuals has been analysed in detail so far. In case of yeast and mammals, however, some clear picture has emerged. The sets of known genes in these two classes of organisms are identical except some differences (Table 18.4). For instance, yeast has 25 tRNA species (more isoaccepting tRNAs), while mammals have only 22 tRNA species. Further, the genes for subunit 9 of the ATPase complex and those for a ribosome associated protein, though present in yeast, are absent in mammals. Mammalian mtDNA is transcribed into a singl'e transcript from the major coding strand, and individual products are generated by RNA processing. In yeast, rearrangements can occur in mtDNA rather frequently (see
Expression of Gene : Protein Synthesis 2. Transcription in Prokaryotes and Eukaryotes and
Expression of Gene : Protein Synthesis 3. RNA Processing (RNA Splicing, RNA Editing and Ribozymes)).
A substantial fraction of the genetic material in mtDNA in yeast as well as in mammals in represented by
unidentified reading frames (URFs). Most of the yeast URFs are contained in introns of split genes and appear to code for protein required for mtRNA splicing, the so called maturases. The URFs of mammalian mtDNA code for proteins of unknown function.
Unidentified Reading Frames (URFs) and protein coding genes in mtDNA. In animals and particularly in mammals, 13 reading frames, coding for proteins (ranging from 70-610 amino acids) have been identified. These are in addition to the genes for ribosomal RNA (rRNAs) and tRNAs. Five of these 13 reading frames code for cytochrome-c oxidase subunit I (CO I), II (CO II) and III(COIII), ATPase subunit 6 and cytochrome b. The remaining eight reading frames, representing 60% of the protein coding sequences, pertain to the so called URFs, whose products have not been identified with any protein of known function. Nothing is known about the physiological role of the products of mammalian mtDNA URFs, except that they are hydrophobic proteins associated with the inner mitochondrial membrane. URF A6L is perhaps homologous to
aapl coding for a protein of 48 amino acids, which may be a part of ATPase complex.
Unidirectional replication of mtDNA (D loops). Another interesting feature of mtDNA is its unidirectional and highly asymmetric replication. The daughter L-strand starts synthesis when two third of H-strand is already synthesized. The position of origin of synthesis of H-strand is marked with displacement loop (D-loop). More details about D-loop and mtDNA synthesis are given in
Chemistry of the Gene 2. Synthesis, Modification and Repair of DNA.
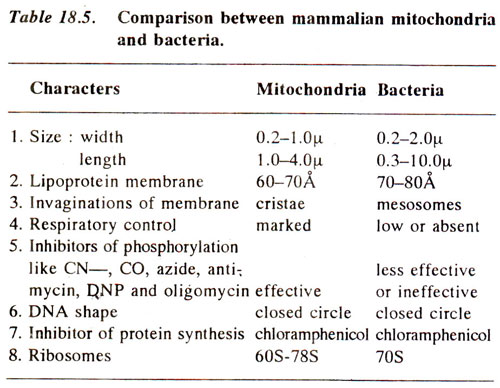
Evolutionary origin of eukaryotic mitochondria from prokaryotes. A comparison between the properties of mitochondria and bacteria has shown similarities which indicate evolutionary relationship. Some of these similarities are listed in Table 18.5. On the basis of these similarities it has been suggested that mitochondria might have evolved due to symbiotic association of bacteria with cells of higher organisms.
In Table 18.5, the last three similarities between mitochondria and bacteria are rather very conspicuous. These include size and shape of DNA, there being circular DNA in both. The DNA in eukaryotic chromosomes is very different than circular DNA found in mitochondria in the same
cells. Further, the protein synthesis in eukaryotic cytoplasm is inhibited by cycloheximide and not by chloramphenicol as in bacteria and mitochondria. This property has been utilized to stop preferentially the protein synthesis in cytoplasm by cycloheximide and thus mark the proteins synthesized in mitochondria or chloroplasts, both responding in the same manner to cycloheximide and chloramphenicol. Similarly, protein synthesis in mitochondria and chloroplasts can be preferentially stopped by chloramphenieol and the proteins synthesized in cytoplasm can then be identified. This property of protein synthesis mechanism is due to similar ribosomes (70S) in chloroplasts, mitochondria and prokaryotes, because the ribosomes in cytoplasm of eukaryotes are very different (80S).


