Fluorescence Microscopy
A. Luminescence, Fluorescence, and Phosphorescence
Luminescent substances emit light when irradiated, in contrast to most other light-absorbing substances, which merely heat up. Luminescence is usually induced by light, but can also be initiated by other electromagnetic radiation or by chemical reactions. In any case, bound or free electrons or atoms or molecules are temporarily excited to a higher energy state. When falling back to a lower state they emit part of the energy in the form of light. Since this excitation/relaxation process itself consumes energy, the wavelength of the emitted light is always longer than that required for excitation (Stoke's law). Fluorescence is emitted within nanoseconds after irradiation, i.e., in biological terms immediately. Phosphorescence manifests rather as an afterglow lasting between fractions of a second and several months.
B. Primary Fluorescence
A number of substances such as oils, optical brighteners, and plastic material but also many tissue components such as chlorophyll or bone intrinsically emit fluorescent light when irradiated with shortwave radiation. This kind of fluorescence is called primary fluorescence (1°-fluorescence) or inherent autofluorescence.
Most of the objects to be investigated with a light microscope, i.e., cells, tissues, and bacteria, do not show an inherent fluorescence. These objects or specific details of these objects are rendered fluorescent either by fluorescent dyes or by tissue processing, e.g., fixation. Light emission caused by fluorochromes added to the specimen is called secondary fluorescence (2°-fluorescence) or just fluorescence. Processing-induced 2°-fluorescence is also called processing-related autofluorescence or, often and also together with inherent autofluorescence, simply autofluorescence.
D. Fluorophores (Fluorochromes)
Fluorophores are, in analogy to chromophores, the chemical groups responsible for the colour of a molecule, the groups responsible for a molecule's fluorescence. Fluorochromes are fluorescent molecules, often dyes. The expressions "fluorophore" and "fluorochrome" are often used equivalently. Each fluorophore has a specific (often overlapping) excitation and emission spectrum with distinct maxima. Calcein, fluorescein, and, in the wider sense, tetracyclines, which accumulate in bone and teeth, are typical fluorochromes. Site-specific fluorescent dyes include the widely used DNA probes 4,6-diamino-2- phenylindole (DAPI), ethidium iodide, Hoechst 33342, and acridine orange, but also include fluorescent analogues of specific membrane lipids (e.g., www/probes, corn/site-specific).
Immunofluorescence (IF) is used to reveal the presence of specific antigens in body fluid, cells, or tissue by means of the corresponding fluorophoreconjugated antibodies and illumination with an appropriate light source. The technique relies on the strong binding between antibodies and corresponding antigens, which allows for washing off nonbound label, thus displaying fluorescent objects against a dark background.
The principle of IF has found wide application in diagnostics, directly for the detection of antigens or indirectly for that of antibodies. In the former case, the presence of an antigen is directly visualized via the corresponding fluorescence-labeled (F-) antibody. Antigens may be viruses, bacteria fungi, etc. In the latter case, a specificmoften immobilizedmantigen is incubated, e.g., with a patient's serum, and in a second step, a F-labeled antihuman immunoglobulin antibody is used to detect the presence of antigen-specific antibodies. The indirect test reveals the presence of antibodies directed against a specific virus or a marker-protein typical for a specific disease.
A. Fluorescence Microscopy (FM)
Conventional bright-field microscopy visualizes structures of cells and tissues via the absorption and diffraction of light. In contrast, in FM, fluorochromes become independent light sources when irradiated with the appropriate exciting wavelengths, while the nonfluorescent surroundings remain dark. FM takes advantage of (i) Stoke's law, i.e., the difference of wavelength between exciting and emitted light, and (ii) the high visibility of fluorescent objects in the dark.
The fluorescence microscope is designed to induce the strongest possible fluorescence in the fluorescent object and the least interference from light of other wavelengths. This is achieved by (i) physically filtering the irradiating light so that it matches the exciting wavelength of the fluorophore and (ii) filtering the light emitted by the specimen in a fashion that only the fluorescent light emitted by the excited fluorophore will enter the optical path. Light of other wavelengths, including the exciting light, is barred off, thus generating a dark background, i.e., "good" image contrast.
The F-labeled object compares to a torch at night: The light is well visible, whereas the structure of the torch itself not. This manifests in the virtual resolution of FM. (i) Even cytoskeletal elements, e.g., microfilaments (6nm), intermediate filaments (8-10nm), and microtubules (25nm), become well discernible when F-labeled, despite the theoretical resolution of ~200nm of the microscopes (Fig. 1; cf. Baschong et al., 1999). (ii) However, it is difficult to decide whether two different fluorescent labels observed at the same spot really colocalize or whether they only appear to overlap because they cross over in space.
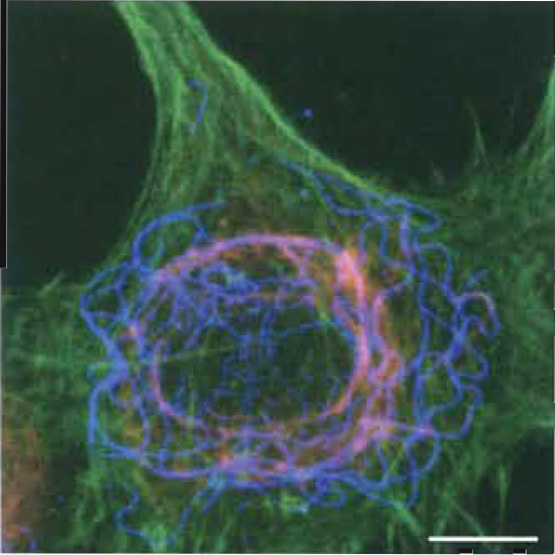 |
| FIGURE 1 Localization of F-actin, vimentin, and tubulin in fibroblasts by fluorescence microscopy and photographical overlay. Rat 2sm6 fibroblasts (Leavitt, and Kakunaga, J. Biol. Chem. (1980)) were grown as monolayer on glass coverslips. Prefixation: 2% octyl-POE (n-octylpolyethoxyethylene)/0.125% glutaraldehyde, 5 min in MHB (Hanks buffer, Ca-free, containing 2 mM EGTA and 5 mM MES, pH 7. Postfixation: 1% glutaraldehyde in MHB (20min) at ~20°C. Removal of background fluorescence with 0.5mg/ml NaBH4 (2 × 10min at 0°C). Labeling: Filamentous actin (green): phalloidin Alexa-488 (www.probes.com); vimentin (blue): mouse anti-vimentin-Cy3 (monoclonal, www.sigma-aldrich.com); and tubulin (red): 1°-antibody, mouse anti-β-tubulin (monoclonal, www.sigmaaldrich. com) and 2°-antibody goat antimouse IgG-Cy5. Composite image by triple exposure. Scale bar: 25 µm. |
Initially, in fluorescence microscopes the beam of the exciting light was transmitted to the object through a bright-field condenser. This type of fluorescence microscope is practically no longer used in biology because the transmitted light causes considerable brightening of the specimen background and, consequently, low image contrast.
2. Fluorescence Microscopes for Incident Light Excitation (Epifluorescence)
Today's fluorescence microscopes work as epifluorescence microscopes and illuminate the object from above, comparable to illumination in reflection microscopy (Fig. 2). Typically, the light source is placed perpendicular to the optical path. The light then passes through an "excitation" filter and hits at an angle of 45° a reflection short pass filter (dichroic beam-splitting mirror) placed in the optical path. As a mirror it deflects the excitation light to the objective (which also functions as a condenser) and ultimately to the specimen. Fluorescent light emitted by the irradiated specimen is collected by the objective lens and transmitted to the reflection long-pass filter (dichroic beamsplitting mirror) again. As a long-pass filter the latter now blocks any reflected excitation light and is translucent only for the longer-waved light emitted by the specimen. This emitted light is further filtered through a barrier or suppression filter before reaching the eyepiece.
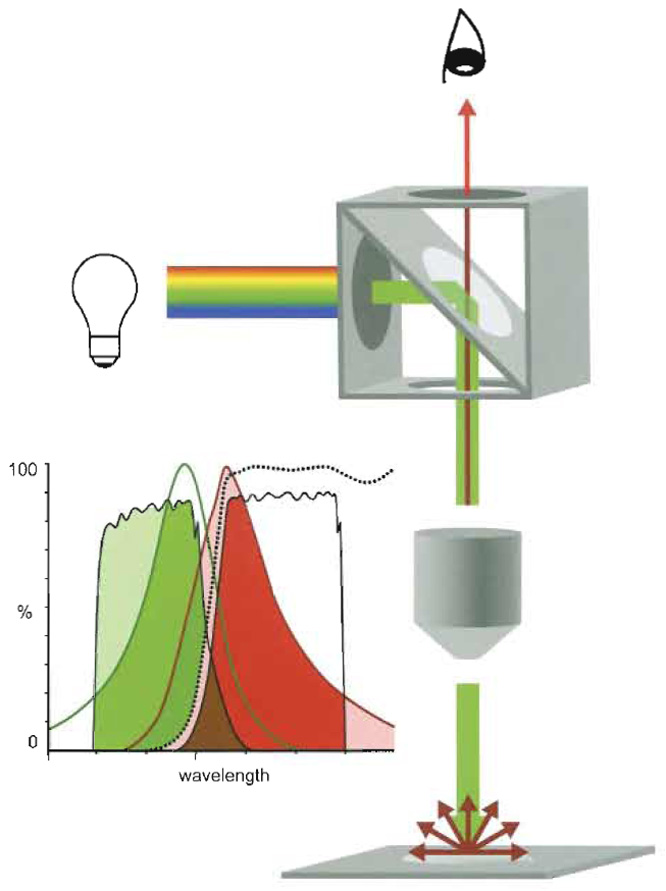 |
| FIGURE 2 The epifluorescence microscope. Light source, positioned perpendicular to the optical axis of the fuorescence microscope, irradiates a cube that is placed in the axis and that comprises an exciter filter (ExF), a dichroic mirror (DM), and an emitter filter (EmF). Only light corresponding to the exciting wavelengths (green) passes ExF and reaches the DM placed at an angle of 45°, where light is deflected along the optical axis to be condensed by the objective (Oj) and focused onto the specimen. Corresponding fluorophores are excited and emit longer-waved fluorescent light (red). The Oj collects the emitted light (red) together with reflected exciting light (green). The DM is transparent for the longer-waved light, but not for the reflected exciting light, i.e., it functions as a long-pass filter. The EmF band pass filter is transparent only for light corresponding to the bandwidth of the emitted light (EmF filters off interfering shorter and longer-waved frequencies) and reaches the eye or the registration device, respectively. Spectral separation by band-pass filters (Exm, EmF) and DM (dotted line) of exciting (green line) light and emitted (red line) fluorescence light, and cross talk. The DM reflects most of the light passing the ExF (light green). This light corresponds mainly to the exciting spectrum of the fluorophore (green). Most of the emitted light (light red and red) passes the DM. The EmF further restrains this light (red) and filters off interfering light of lower or higher wavelength. However, because the transparence of ExF and EmF and the spectra of exciting and emission spectra are rarely separated but overlap to some extent, separation is not complete. Part of the higher wavelength light confined by the ExF passes the DM and also the EmF, where it adds as cross talk to the emitted signal (brown). Comparably, a part of the emitted light passes in the exciter channel. |
B. Components of the Fluorescence Microscope
1. Light Sources
Fluorescence microscopes require a light source, which illuminates the field of view (i) evenly and uniformly (ii) at the exciting wavelength dictated by the fluorochrome and (iii) with high intensity, as the fluorescence yield amounts only to a few percent of the excitation energy. High-pressure gas discharge lamps such as mercury (HBO) or xenon (XBO) arcs are most suitable. HBO burners emit a spectrum of a background continuum with the typical high-intensity mercury lines (Fig. 3). The XBO spectrum is also continuous. It is more intense in the red and far-red and comes closer to the spectrum of daylight (Fig. 4). HBO are usually preferred for conventional FM because of the higher radiation output in the ultraviolet to green region.
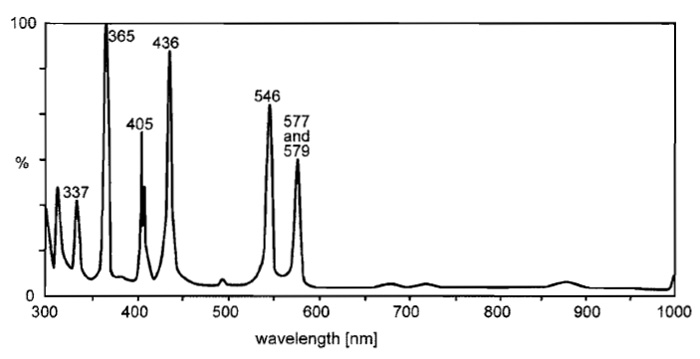 |
| FIGURE 3 Relative spectral radiation of a high-pressure mercury lamp (HBO). Note the typical mercury lines of intense radiance. Courtesy of www.osram.com. |
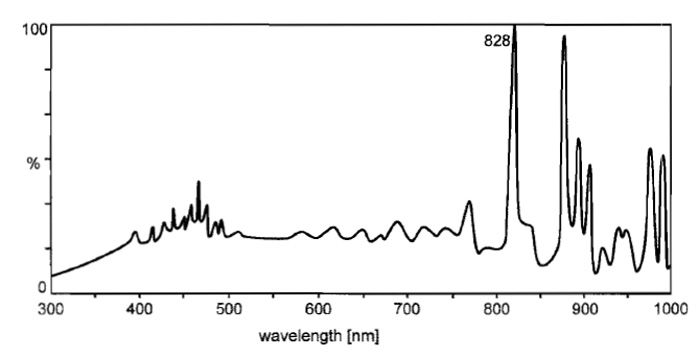 |
| FIGURE 4 Relative spectral radiation of a high-pressure xenon lamp (XBO). |
For even and uniform illumination, proper alignment of the arc is prerequisite. Since gas discharge lamps (50-400 W) operate at 10-15 bars and generate a substantial amount of heat, manufacturers instructions on alignment, installation, and safety are compulsory. (For light sources and spectra, see, e.g., www.esrf.fr, www.heraeusnoblelight.com; www.osram.com; www. olympusbiosystems.com.)
Filters for FM are designed to selectively transmit light matching the excitation wavelength of a given fluorochrome (exciter, excitation filter), to transmit only the light emitted by fluorochrome fluorescence (emitter, emitter barrier filter), or to separate the exciting and emitted light (dichroic mirror).
The three elements are usually mounted in blocks (Fig. 2) and are inserted into sliders or filter wheels. This allows for rapid switching of filter sets and facilitates operation at multiple channels. Exciter and emitter filter have to be oriented exactly at 45° to the dichroic mirror and the emitter filter perpendicular to the optical axis. Moreover, precision of the sliding mechanism is prerequisite (shift free), as the images of different filter sets will be displaced laterally, a phenomenon typically manifested when recording multifluorescence images via supraexposure.
Filters are characterized by their transmission and absorption or reflection properties: Short-pass (KP, SP) filters transmit light up to a certain cut-off wavelength and absorb longer wavelength light. Absorption of short wavelength and transmission of long wavelength light are provided by long-pass (LP) or barrier filters. Today, band-pass (BP) filters (Fig. 2) or multiple band-pass filters, which are translucent for one or several specific bands of wavelength, are most widely used. Dichroic mirrors (dichroic beam-splitting mirrors, color dividers, or reflection long-pass filters) also display LP characteristics. Multiple dichroic mirrors are translucent for several specific bands of wavelengths.
3. Objective Lenses
The numerical aperture of the objective is the single most important factor for the brightness of the fluorescent image: Objectives with larger apertures concentrate more of the exciting light (illumination) on the specimen and collect more of the emitted light forming the fluorescence image. Because both the intensity of excitation and that of the emitted image are proportional to the square of the numerical aperture (NA) of the objective lens and inverse proportional to the overall magnification (Magtot), the brightness (B) of the image increases with the fourth power of the NA,
| B= | (NAobj)4 |
| (Magtot)2 |
i.e., the higher the NA of an objective and the lower its magnification, the brighter the resulting image. Consequently, immersion objectives with their high numerical aperture are preferred even for low magnifications and they are combined with an eyepiece or with intermediary optics of the lowest magnification needed to detect the details of interest.
When working with tissue, where overview images are essential, low magnification objectives (0.5-4×) should be accessible. Note that phase rings in an objective lens will reduce light throughput by up to 25%.
4. Recording Systems
a. Photomicrography. High-quality photographic recording of fluorescent images is not trivial. Because the emitted light is of low intensity, fast, i.e., highly sensitive, and therefore grainy, films have to be used. Nonetheless, exposure times will be long, which requires correction of the automatic exposure measurements by a film-specific reciprocity factor. Automatic illumination measurements are deceived by the nature of the fluorescent image, which is made up of a small bright signal against a large dark background, thus rendering integrated and spot measurements equally ineffective.
Image resolution depends directly on the number of pixels registered per frame. For most applications, 1 megapixel, which yields images with a resolution roughly equivalent to 35-mm photographic film, is sufficient. Because CCD cameras are most sensitive in the red and far-red parts of the spectrum, auto gain control (AGC) should be switched off except when an infrared blocking filter is used.
Digital registration facilitates image processing and analysis. However, image files are of considerable size and require appropriate space for storage.
A. Choice of Filters
The selection of filters is dictated by the fluorophores intended to use (or vice versa). The latter have been roughly divided into four classes: (i) ultraviolet dyes, which are excited by UV light (~350nm) and emit in the blue spectrum (~450nm), (ii) fluorophores of the fluorescein isothiocyanate (FITC) class excited in the blue (~490nm) and emitting in the green (~520nm), (iii) rhodamine class dyes excited in the green (~560nm) and emitting in the red (~580nm), and (iv) fluorochromes such as Cy5 excited by red light (~630nm) and emitting in the far red (N660nm). For each class of fluorochromes, specific exciter/emitter filter blocks are available. Lists of fluorochromes, their spectral characteristics, and the appropriate filter sets are displayed by all major manufactures (e.g. www.chroma.com; www.seojinft. co.kr; www.omegafilters, www.schott.com).
Combinations of multiband-pass filters for the simultaneous observation and recording of two to three fluorochromes are also available. The latter are excellent for the observation of moving live specimens, but are generally more prone to cross talk than single channel filters. Alternatively, multiple fluorescence imaging can be performed by single channel imaging in conjunction with multiple photographic supraexposure.
B. Plasticware, Immersion Media, Embedding Resins, Mounting
For FM of cultured cells, culture medium and plasticware should not contain fluorescent compounds. Immersion oils, embedding resins, and mounting media should not fluoresce. Manufacturers often specify products as "safe to use for FM." Nonetheless, a quick check under the FM possibly together with the fluorochrome intended for use is never a waste of time.
Polymerizing mounting media such as Mowiol (Hoechst 1188, www.sigma-aldrich.com) generate stable mounts and exclude oxygen better than glycerol. In both cases, specimens should be stored in the dark, preferentially at 4°C.
C. Fading
In chemical terms, fading is caused by light-induced oxidation and decay of the fluorochrome, i.e., fluorescence underlies continuously progressing and irreversible destruction (Berrios ei al., 1999). Fluorochromes vary considerably with respect to fading; whereas FITC and green fluorescent protein (GFP) are highly sensitive, more recently introduced fluorochromes, such as indol-cyanine-based Cy dyes (www.amersham.com) and coumarin- or rhodaminderived Alexa dyes (www.probes.com), are extremely stable toward light and oxygen. Nonetheless, exposition of a F-labeled specimen to light and oxygen should be minimized and radical scavengers, e.g., n-propylgallate (www.sigma-aldrich.com), added to the mounting medium. The shutter at the light source should be used as often as possible. In addition, excitation intensity should be adjusted to the lowest possible level. Samples should be stored in the dark at 4°C.
Inherent 1°-autofluorescence in cells often relates to the presence of NADH, riboflavin, or lysosomal residual material (lipofuscin) that are excited by near UV and blue light. If fluorescence labeling is expected to be weak, using fluorochromes emitting in the red or far-red may thus be advantageous. Furthermore, specific cell and tissue constituents such as chlorophyll in plants, hemoglobin in red blood cells, and elastic fibers, mast cell granules, bone, and so on in tissue typically exhibit 1°-autofluorescence
2°-processing-related autofluorescence is essentially caused by fluorescent contaminants either due to unspecific adsorption of fluorescent molecules, e.g., fluorescent probes during processing, or generated by fixation, e.g., due to binding of fluorescent probes by nondeactivated aldehydes or by generation of glutaraldehyde or acrolein-derived polymers.
E. Poor Fluorescence Contrast
Poor contrast in a fluorescent image can be the effect of various causes: (i) autofluorescent contaminants in the immersion oil or (mounting) medium and (ii) inadequate filter combination with cross talk between excitation and emission wavelengths. (iii) If spectral properties seem to be adequate, poor contrast may be due to "minidefects" in the exciting filter. (iv) In thicker specimens, fluorescence generated above and below the focal plane may obscure the image. Those specimens need deconvolution and/or examination by confocal microscopy.
A. Principle Immunofluorescence microscopy (IMF) takes advantage of both fluorescence microscopy, as initiated about hundred years ago by K6hler and others for the documentation of autofluorescent or fluorescencestained structures, and detection of fluorophoreconjugated antibodies, as introduced by Coons and Kaplan (1950). Specific cell and tissue constituents are visualized by IF either (i) directly (direct IF, primary fluorescence, 1°-IF) by fluorophore-conjugated antibodies (F-antibody) raised against the antigen of interest or (ii) indirectly (indirect IF, secondary IF, 2°-IF) via incubating a specimen, e.g., with a serum containing specific antibodies and revealing their presence by means of F-antibodies against the class and species of the first antibody (Fig. 5). Indirect IF is usually preferred because the 2° F-antibodies can be used against any primary antibodies of the appropriate class. Moreover, 2°-IF seems to provide brighter signals, as a 1°-antibody can bind more than one 2°-F-antibody. For multiple labeling 1°-IF, 2°-IF and site-specific fluorescent stains such as DAPI and F-phalloidin, are frequently combined.
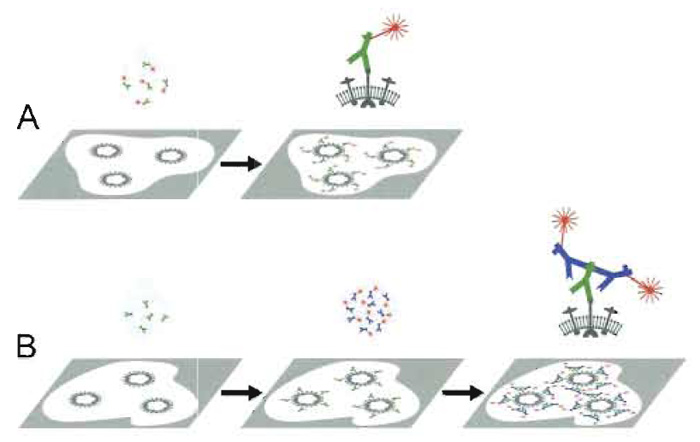 |
| FIGURE 5 Primary and secondary immunofluorescence labeling. Primary immunofluorescence (A): A specimen with the antigen to be visualized (e.g., a viral surface protein) is incubated with the specific antibody conjugated to a fluorophore. Excess antibodies are washed off. Fluorescence microscopy reveals the presence of the antigen (e.g., the virus) directly as fluorescent signals. Secondary immunofluorescence (B): The same specimen is first incubated with antigen-specific antibodies (e.g., a rabbit serum) and excess is washed off. The specimen is then incubated with fluorophore-conjugated antibodies directed against the species and type of the primary antibody (e.g., antirabbit IgG antibodies raised in goat) and excess is washed off. The presence of the antigen manifests in the fluorescence microscope as a fluorescent signal. Since more than one secondary antibody may bind to each primary antibody, the signal may be stonger than obtained by primary immunolabeling. |
1. Objective Slides
Sample processing for IFM involves several steps of extensive washing and may be preceded by deparaffination. Specimen sections may not adhere enough to withstand such manipulations and get lost during washing. Adhesion of sections can be improved by using silanized or polylysine-treated slides
(e.g., www.emsdiasum, com/ems/histology/slides.html) (see also article by Osborn and Brandfass).
2. Permeabilization
In specimens involving whole cell preparations or thicker tissue sections (e.g., cryostat sections), cytosolic proteins may be hardly accessible for antibodies because of the cell membrane (Fig. 6). In order to preserve the three-dimensional architecture of intracellular elements, e.g., of the cytoskeleton, the membrane lipids should be removed without interfering with the intracellular architecture. This is achieved either by chilled alcohol or acetone or by detergents used together with aldehydes. The principal steps are the same: During extraction of the membrane lipids by the solvent, e.g., ethanol, the detergent solution, or even the aldehyde solution itself, the solvent penetrates into the cell interior and immediately stabilizes the interior elements either by alcohol precipitation or by aldehyde cross-linking, respectively.
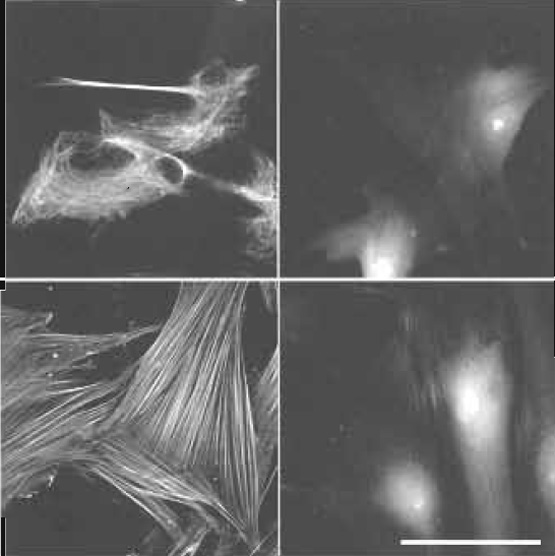 |
| FIGURE 6 Effect of permeabilization/prefixation on cytoskeletal labeling. Human dental ligament cells on glass coverslips. Top, bottom (left) with and top, bottom (right) without permeabilization/prefixation as described in Fig. 1. Labeling: vimentin (top): Cy3 antivimentin (monoclonal mouse, www.amershambiosciences.com). F-actin (bottom): TRITC-phalloidin (www.sigma-aldrich.com). Cytoskeletal labeling only in permeabilized cells. In nonpermeabilized cells actin is partially accessible for small phalloidin (1250 Da) but not for large anti-vimentin IgG (~150,000 Da). Scale bar: 25µm. From Baschong et al. (1999). |
3. Physical Fixation
While cryofixation and cryosectioning have become state of the art, microwave fixation, i.e., heat-related denaturation and stabilization of tissue and cells, comparable to boiling an egg, has not yet reached general applicability. In connection with FM it is used preferentially in a clinical environment. Preservation of morphology and antigenicity by microwave fixation is apparently comparable to cryopreservation or to chemical fixation, yet it can be achieved within several orders of magnitude faster and in tissue probes as large as 1 cm 3. However, extensive calibration and preferably specific microwave devices are prerequisites for proper performance. Employing common large-cavity microwave devices (e.g., household) will lead to irreproducible results if not calibrated properly (for details, see Login and Dvorak, 1994; Giberson and Demaree, 1995).
a. Fixation by Solvents. Fixation by solvents is common in immunohistochemistry. These organic solventsmmost often methanol or acetone chilled to -20°C-disrupt the membrane and simultaneously precipitate the proteins in the cytosol. Protein precipitation of intracellular elements might displace intracellular structures and induce cytoskeletal elements to coalesce. However, especially when using cryo sections, solvent fixation may dissolve lipophilic surface layers that interfere with antibody access or may denature proteins and make them more accessible for antibodies prepared from denatured antigens. For processing plant and yeast material and also for certain endoparasites (W. Baschong, personal communication), solvent fixation has proven advantageous.
b. Fixation by Aldehydes. Formaldehyde and, to a lesser extent, glutaraldehyde and acrolein are used routinely for the stabilization of supramolecular assemblies, e.g., of cytoskeletal and cytoskeletonassociated elements, i.e., for preserving the three-dimensional (3D) architecture of cell and tissue constituents. Formaldehyde is usually diluted to a final concentration of 4-5%, either from a concentrated 37% stock or from freshly dissolved paraformaldehyde (so far we have not experienced differences in performance of one or the other), acrolein, or glutaraldehyde to a final concentration of 1%. Indeed, at the electron microscopic level, structural preservation of pure protein assemblies by either solution proved comparable (Baschong et al., 1984). Glutaraldehyde seems to react faster and to polymerize in the presence of oxygen to a large network, whereas formaldehyde seems to react slower and via oligomeric HCHO chains (Baschong et al., 1983). In fact, this is also reflected in the depth of antibody penetration: While immunolabeling of liver tissue fixed with 0.1% glutaraldehyde tissue was confined to a surface zone of about 1µm, labeling of the same tissue fixed with 4% paraformaldehyde proved to be regular and intense down to 5µm (L. Landmann personal communication). In our hands, 4-5% HCHO for routine microscopy or 1% glutaraldehyde postfixation in conjunction with permeabilization provided acceptable results in most cells and tissue. Nonetheless, it should be kept in mind that the mode of fixation can affect the antigenicity (see Section IV, B,4), i.e., optimal fixation conditions for immunolabeling an antigen in a specific tissue have to be established by trial and error. Tris buffers should not be used. They react with aldehydes under liberation of HCl, which may destroy the specimen.
Preservation of antigenicity is of major concern in IFM. However, tissue preservation and embedding involves denaturation (microwave and solvent fixation) or chemical cross-linking of proteins, i.e., processes that may, and often do, affect the epitopes an antibody had been raised against. Moreover, in cryopreserved specimens, where denaturation is least, epitopes may become degraded by nondeactivated proteases. In short, there are no rules indicating how to minimize loss of antigenicity other than trial and error. At least, most suppliers of antibodies now indicate at which conditions successful labeling had been achieved with their products, thus providing the first step toward optimal labeling.
6. Managing Autofluorescence
Secondary preparation-related autofluorescence mostly relates to chemical fixation: Nonreacted aldehyde groups [e.g., of glutaraldehyde or (paraformaldehyde)] bind fluorescence markers either directly or via binding antigens or primary antibodies, thus creating substantial background fluorescence. Binding can be prevented by blocking aldehyde groups with amines such as glycine and ethanolamine, or by reducing them to OH-groups by sodium borohydride. The latter also considerably reduces the fluorescence of glutaraldehyde-derived polymers (Fig. 7).
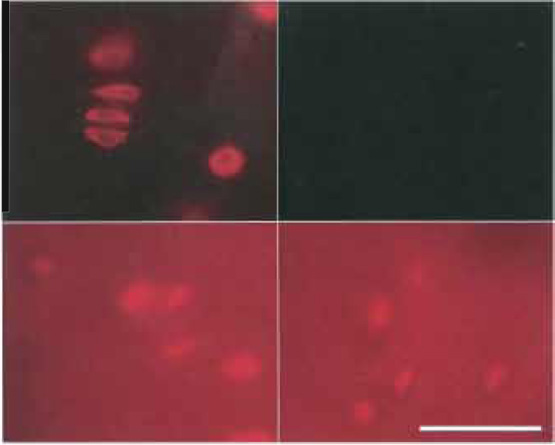 |
| FIGURE 7 Control of background fluorescence by NaBH4. Bovine articular cartilage (100-µm-thick sections). Fixation as described in Fig. 1, but prefixation 40min and postfixation 60min. Top (left and right): Treatment with 5mg/ml NaBH4, 2 × 30min. Bottom (left and right): Control without NaBH4-treatment. Labeling: Left (top and bottom): Cy3 antivimentin; right (top and bottom): nonlabeled control. Top: exposure time 2s, bottom: exposure time 0.2s. From Baschong et al. (1999). |
C. Antibody Conjugates
1. Preparation of Fluorescent Antibody Conjugates
Historically, fluorochromes, e.g., carboxyfluorescein, were coupled directly to the antibody of interest. Nowadays, not only antibodies coupled to a variety of fluorochromes and against practically all types of primary antibodies, but also a lot of fluorophoretagged primary antibodies against many structural and pathological markers are available from a multitude of suppliers. For specific fluorescence labeling of antibodies, e.g., in conjunction with primary IFM, specific labeling kits comprising a variety of fluorochromes are on the market (e.g., www.amersham.com).
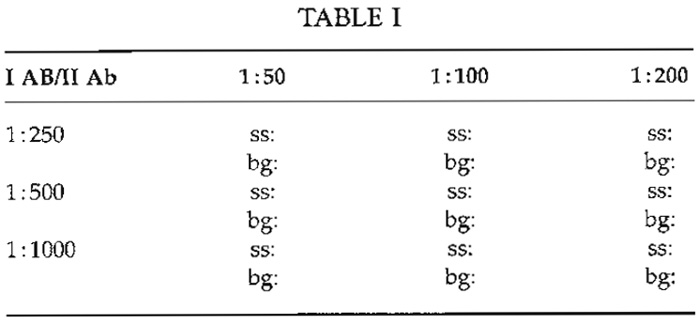
For FM, the antibody titer is defined as the highest dilution, which results in optimal specific staining with the lowest possible background. This dilution has to be determined empirically for each antibody. Typically, titers vary from 1:5 to 1:100 for monoclonals in cell culture supernatant, from 1 : 100 to 1:2000 for polyclonal antisera, and up to 1:100,000 for monoclonals in ascites fluid. Manufacturers occasionally indicate a dilution range that may serve as a starting point for titration. Typically, checkerboard titrations (Table I) are used to determine the optimal dilutions of more than one reagent simultaneously, e.g., of a primary and the corresponding secondary antibody.
One slide is prepared for each pairing, i.e., nine (32 ) slides if three dilutions of the 1° and the 2° antibody have to be tested. Test slides are judged visually for both specific staining/labeling (ss) and background fluorescence (bg). If different dilutions show identical or similar results (indicated by oblique line in Table I), antibody costs can become a criterion for selection.
 |
Negative controls carried out in parallel, i.e., performing the labeling protocol without the 1° antibody or without 2° antibody, indicate unspecific binding of the 2° antibody or autofluorescence, respectively.
3. Labeling with Primary or Secondary Fluorescence Antibodies
Incubation time and incubation temperature are interdependent with the antibody titer, although with less influence on the quality of labeling than the latter. Generally, incubation times between 30 and 120min at ambient temperature are sufficient. When labeling intracellular elements, e.g., cytoskeletal structures, in permeabilized 3D-cell cultures or tissue, 3-4 h of incubation with the 1° antibody at 20°C followed by three to four washes for 10min each and subsequent incubation with the 2°-F-antibody and four to five washes for 10-20rain is adequate (Baschong et al., 1999). Antibodies with lower affinity may perform better if incubated overnight at 4°C.
Occasionally, incubation at an elevated temperature (e.g., 37°C) in combination with microwave treatment is reported. Such conditions may be optimal for the specific antibody and tissue described, yet difficult to transform to other experiments without extensive calibration (see also microwave fixation).
Unspecific binding of 1° or 2° antibodies or both results in background labeling. Underlying mechanisms are manifold and difficult to elucidate. Nonetheless, some general precautions will reduce the risk. Unspecific binding of polyclonal antisera can be reduced by employing only its immunoglobulin G fraction isolated via affinity chromatography, e.g., over a protein A column (e.g. www. amersham.com; www. bio-rad.com). Unspecific binding can be reduced further by cross-absorption of antibodies against preimmune serum from the species providing the antibody andmin case of multiple labelingmagainst the antibodies used for labeling in other channels.
Unspecific binding due to hydrophobic interactions can be reduced by incubation with a 1% solution of a blocking protein such as albumin, ovalbumin, or gelatin, either prior to the primary antibody step and/or together with the antibody solution.
As indicated previously, antibodies are available from a multitude of suppliers, be it nonlabeled as antisera, as affinity-purified immunoglobulines, as monoclonal antibody preparations, or as F-labeled 1° and 2° antibodies (e.g., www.amersham.com; www.jacksonimmuno.com; www.probes.com; www.sigma-aldrich.com; www.dianova.de). Such preparations may be supplied in buffer as concentrated or diluted solutions, as frozen or freeze-dried preparations, etc. There are no standard conditions for supplying antibody preparations. The form in which they are supplied is at least in part dictated by the environment wherein they best maintain their activity. Antibody preparations may be sensitive to high salt or low salt concentrations and to high or low pH. They may contain traces of proteases, limiting their shelf life. Other preparations may be sensitive to freezing and should definitively be stored above 0°C. Some freezedried preparations may already contain the amount of salts required for yielding the appropriate buffer solution upon reconstitution; then reconstitution with phosphate-buffered saline (PBS) instead of the indicated water may turn out detrimental. In consequence, keeping antibodies at other conditions than indicated by the provider may interfere with their activity. Fluorescent probes should always be kept in the dark. Antibody solutions should be protected against microorganisms (e.g., by 0.1-0.05% sodium azide).
V. MISCELLANEOUS
A. Green Fluorescent Protein and Analogues
The discovery of GFP of the jellyfish Aequorea victoria less than 10 years ago has added a new dimension to the study of cells and their molecular organization (Miswender et al, 1995; Wouters et al., 2001). Directly engineering the GFP sequence into the protein of interest not only reveals its topology, but also allows for the visualization of dynamic processes, such as polymerization/depolymerization reactions, intracellular transport, and ligand binding and in living cells and by time-lapse FM.
CFP and YFP are the most widely used pairs for multifluorescence imaging. Corresponding multipass filters for simultaneous imaging are available. Because of the cross talk, weak signals are best visualized by the consecutive application of single channel filters or, more accurately, by "spectral fingerprinting" using confocal microscopy.
The recent introduction of reef coral fluorescent proteins (RCFPs), which include variants with emissions in the cyan, green, yellow, red, and far-red part of the spectrum, has increased experimental flexibility greatly. RCFPs make powerful tools for monitoring promoter activity, labeling whole cells, and, in some cases, visualizing organelles. The RCFP "DsRed" has been combined with GFP or with YFP and CFP, respectively (www.bdbiosciences.com) (see also article by Rottner et al.).
B. Multiparameter Strategies
1. Double Labeling-Multiple Labeling
Several antigens or specific sites in a specimen can be labeled as long as the fluorescent probes comprise fluorophores of different classes. For multifluorescence labeling it is advisable to use the more stable fluorochromes of the Cy (www.amersham.com) or Alexa (www.probes.com) series. The sequence of labeling may be crucial in limiting cross-reactions and weak labeling due to steric hindrance. As a rule of thumb, indirect labeling using 2°-F-antibody should precede direct labeling with 1°-F-antibody, F-phalloidin, DAPI, etc., and polyclonal antibodies should be used prior to monoclonal antibodies.
2. Multipass Filters Versus Sequential Recording
Multichannel fluorescence (e.g., double or triple label IF) can be monitored with specific filter sets that are designed to visualize up to four fluorochromes simultaneously. Multichannel imaging is ideal for imaging dynamic processes and for live cell imaging, as the time-consuming switching of channels is obsolete. In general, multipass filters are more prone to cross talk and less sensitive than single channel filter sets.
Subsequent recording of each fluorochrome with its appropriate filter set yields better separation of channels and higher sensitivity. It permits also to manually balance brightness of the different channels. However, the perfect x/y register (shift free) of the different images is crucial. In case of need, the filter alignment can be tested with special fluorescent beads (alignment beads, e.g., www.probes.com; www.bio-rad.com).
Acknowledgments
We thank Markus D/irrenberger and Rosmarie Sfitterlin for continuous help and critical discussions. This work was supported by the M.E. Mfiller- Foundation (WB) and by the Kanton of Baselstadt (LL, WB).
Baschong, W., Baschong-Prescianotto, C., and Kellenberger, E. (1983). Reversible fixation for the study of morphology and macromolecular composition of fragile biological structures. Eur. J. Cell Biol. 35, 1-6.
Baschong, W., Baschong-Prescianotto, C., Wurtz, M., Carlemalm, E., Kellenberger, C., and Kellenberger, E. (1984). Preservation of protein structures for electron microscopy by fixation with aldehydes and/or OsO4. Eur. J. Cell Biol. 35, 21-26.
Baschong, W., Dtirrenberger, M., Mandinova, A., and Suetterlin, R. (1999). Three dimensional visualization of the cytoskeleton by confocal laser scanning microscopy. Methods Enzymol. 307, 173-189.
Baschong, W., Suetterlin, R., and Laeng, R. H. (2001). Control of autofluorescence of archival formaldhehyde-fixed, paraffinembedded tissue in confocal laser scanning microscopy (CLSM). J. Histochem. Cytochem. 49, 1565-1571.
Berrios, M., Conlon, K. A., and Colflesh D. E. (1999). Antifading agents for confocal fluorecence microscopy. Methods Enzymol. 307, 55-79.
Giberson, R. T., and Demaree, R. S., Jr. (1995). Microwave fixation: Understanding the variables to achieve rapid reproducible results. Microsc. Res. Tech. 32, 246-254.
Kagayama, M., and Sasano, Y. (1999). Mounting techniques for confocal microscopy. Methods Enzymol. 307, 79-84.
Leavitt, J., and Kakunaga, T. (1980). Expression of a variant form of actin and additional polypeptide changes following chemicalinduced in vitro neoplastic transformation of human fibroblasts. J. Biol. Chem. 255, 1650-1661.
Login, G. R., and Dvorak, A. M. (1994). Methods of microwave fixation for microscopy: A review of research and clinical applications: 1970-1992. Prog. Histochem. Cytochem. 27, 1-127.
Miswender, K. D., Blackman, S. M., Rohde, L., Magnuson, M. A., and Piston D. W. (1995) Quantitative imaging of Green Fluorescent Protein in cultured cells: Comparison of microscopic techniques, use in fusion proteins and detection limits. J. Microsc. 180, 109-116.
Small, J. V., and Celis, J. E. (1978). Direct visualization of the 10nm (100 A) filament network in whole and enucleated cells. J. Celt Sci. 31, 393-409.
Wouters, E S., Verweer, P. J., and Bastiaens, E E (2001). Imaging biochemistry inside cells. Trends Cell Biol. 11, 203-211.


