Optical Tweezers: Application to the Study of Motor Proteins
Optical tweezers allow the study of interactions of single molecules of motor proteins with the track, actin or microtubules, on which they run. The mechanical properties of cellular motors can only be studied at the single molecule level, and for those that act in organised structures, notably muscle, study at this level avoids the complexity of interpreting the effect of large numbers of motors acting in parallel and asynchronously. This article concentrates primarily on the use of the "bead-actin-bead dumbbell" method (Finer et al., 1994, Fig. 1) for studying actomyosin interactions, which necessitates the use of a dual-beam trap. This approach is particularly useful for nonprocessive actin-based motors, but many of the principles are equally applicable to processive actin and microtubule- based motors. Sheetz (1998) has edited a useful volume of articles on laser tweezers in biology.
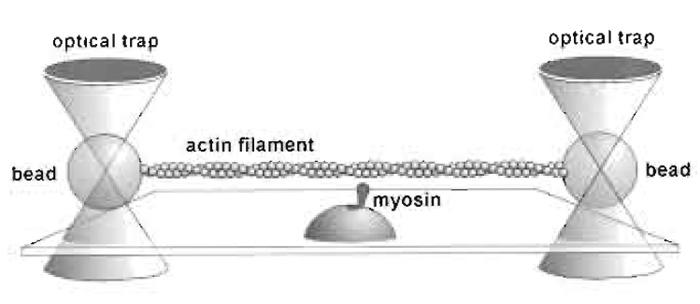 |
| FIGURE 1 The dumbbell setup. |
II. MATERIALS AND INSTRUMENTATION
- Optical table (~4 x 3 ft).
- Research-quality inverted microscope with provision for epi-illumination, a xenon light source for bright-field imaging, and an objective >60x and ≥1.25 NA with good transmission properties at 1064 nm.
- A high-quality piezo-controlled stage (e.g., Physik Instrumente P-528) and a piezo-controlled focussing device (e.g., Physik Instrumente P-723 or with superior capacitative position sensor P-725).
- Nd:YAG laser ≥ 1W.
- Two 2-mm aperture electro-optic deflectors (EOD) (Leysop) with associated high-voltage amplifiers (Apex sells inexpensive high-voltage hybrid amplifiers).
- Two CCD cameras and one intensified camera for fluorescence.
- Dual-photodiode quadrant detector (QD) and associated electronics with a frequency response >10kHz.
- One computer with DAQ board for primary data acquisition and one with frame grabber for servocontrolled stage feedback. (A single computer might suffice for these two applications.) We use National Instruments DAQ boards and frame grabbers in association with Labview software.
The standard single-beam gradient setup is capable of trapping small particles, e.g., 1-µm latex beads, of higher refractive index than the surrounding medium. The mode of operation has been explained in varying degrees of detail in many review articles, including the compilation by Sheetz (1998). Most modern microscopes use infinity-corrected optics and we will assume this to be the case in this article. To form a trap, a parallel beam must fill the back focal plane of the objective, i.e., be ~5mm in diameter. Most of the common lasers used for trapping emit narrower beams than this, which necessitates the use of a beamexpanding telescope. This could be a proprietary item but in order to place all the optical components in their correct positions, it is more convenient to use two separate lenses for this purpose (Figs. 2 and 4). Outside the beam-expanding telescope, it is the angle of the laser beam that controls the position of the trap, whereas within the beam-expanding telescope, i.e., between L1 and L2, it is the lateral displacement of the beam. The mirror in Fig. 2 is in a plane that is conjugate to the back focal plane of the microscope so that the amount of light entering the objective is independent of the angle of the mirror. This mirror allows initial positioning of the trap at the beginning of the experiment. An electro-optic or acousto-optic deflector at or near this position allows rapid control of trap position.
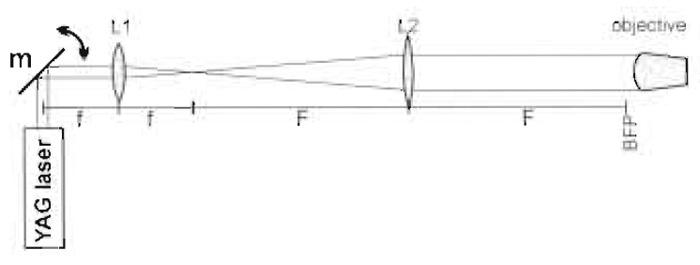 |
| FIGURE 2 Basic optics of the trapping beam (m = m3 in Fig. 3). Focal lengths are f and F and BFP is the back focal plane of the objective. |
An optical trap setup has to fulfill several other functions besides trapping. For actomyosin experiments, a bright-field image is required to visualise the beads for trapping and a video-rate fluorescence image is required for attaching the actin filaments to the beads, which necessitates an intensified CCD camera. The positions of the two beads of the dumbbell must be measured with a precision of ≤1nm with a frequency of >
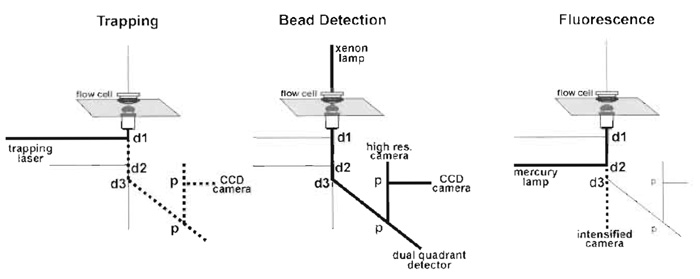 |
| FIGURE 3 The main light paths. Dotted lines in the trapping panel correspond to the reflected light, which is useful for alignment and in the fluorescence panel to the emitted fluorescence, d are dichroic mirrors and p are beam splitting prisms. |
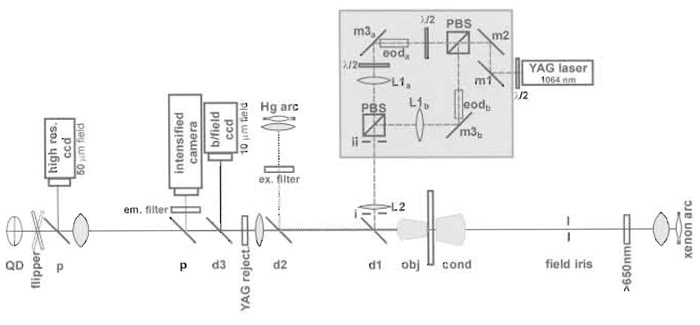 |
| FIGURE 4 Diagram of the trap setup. |
On the first occasion, alignment of the two trapping beam can cause frustration, but the following protocol works even if the trap is being constructed from scratch rather than being based on a microscope. It is based on the principle of sending a HeNe or similar visible laser beam backwards through the microscope to define the optical axes of the various light paths. Laser safety glasses are required during the alignment procedure.
- Check that the microscope stage is horizontal with a spirit level.
- Establish a rough vertical optical axis by dropping a plumb line from the ceiling to the centre of the objective holder.
- To refine the line of the beam, attach a tiltable mirror at the ceiling so that the HeNe beam can be reflected back to the objective. Place a mirror on the stage and adjust the position of the HeNe beam on the ceiling mirror and the angle of that mirror so that the beam is hitting the centre of the objective and is being reflected back along itself.
- Before extension of the optic axis to the trapping laser, remove lenses L1 and L2 and the EODs from their provisional positions. Replace the microscope objective with a ~4-mm aperture (readily made from an old objective) to let the reference beam through. This defines the back aperture of the objective.
- Centre two apertures on the HeNe beam, as widely spaced as possible between the microscope and the recombining prism (positions i and ii in Fig. 4).
- Switch on the trapping laser and make the two paths collinear with the HeNe laser beam. For path a, orientation of m1 allows the trapping beam to be made coincident with the reference beam at m2, and the orientation of m2 allows it to be made collinear with the reference beam. For path b, a small rotation of the first polarising beam splitter together with orientation of its prism table allows the trapping beam of path b to be made concident with the reference beam at m3b, and orientation of m3b allows the beams in path b to be made collinear. Any CCD cameras attached to microscope ports now show the beam in the centre and those not on microscope ports should be centred at this time. The focus of the cameras should be adjusted to correspond to that of the microscope eyepiece.
- Replace the objective aperture with the objective, place a dry flow cell (construction described later) on the stage and focus on the inner surface of the cover slip. The alignment should be adequate to see the reflected laser beam with a low-magnification, infrared-sensitive CCD camera. Fine-tune the alignment of the trapping beams to make the diffraction pattern around the reflected image symmetrical.
- Lens L2 can now be inserted at its focal length F (~300mm) from the back focal plane of the objective and positioned laterally so that the reversed beam still impinges on the trapping laser and the reflected image remains symmetrical. Note that L2 focusses the trapping beam at the back focal place of the objective. The laser beam should be turned down to minimum intensity to avoid damage.
- Insert the two lenses L1 at a distance (f + F) further back from L2 so that L1 and L2 form beamexpanding telescopes (Fig. 2). Adjust their lateral position so that the reflected image is again symmetrical. If the objective is replaced by the aperture, the parallel beam should hit the ceiling mirror at the same point as the HeNe laser.
- The apparatus should now be able to trap 1-µm beads. A small adjustment of axial position of lenses L1 can be used to fine control the z position of each trap.
- Adjust the orientation of the mirrors m3 to position the two traps for the dumbbell experiment ~6µm apart.
- Position the electro-optic deflectors (EOD) as near as possible to the mirrors m3. EODs are convenient because, in the absence of an applied voltage, the beam is not deflected. If an AOD is used rather than an EOD, typically the angle of the beam will change at this point, which will need some realignment. Some AODs are more convenient in that they have the far face cut so that refraction compensates for the diffraction and at the centre frequency the first-order beam remains parallel to the input beam.
- The relative intensities of the two beams can be monitored using an adequately large (~1 cm) photodiode mounted above the field stop of the condenser and equalised by rotation of the λ/2 plate positioned prior to the first beam splitter. The stiffness of the two traps should now be roughly equal.
- Equalise the height at which the two beads are trapped by final positioning of the lenses L1. Move the lenses L1 closer to the microscope to move the trapped bead further from the surface of the coverslip.
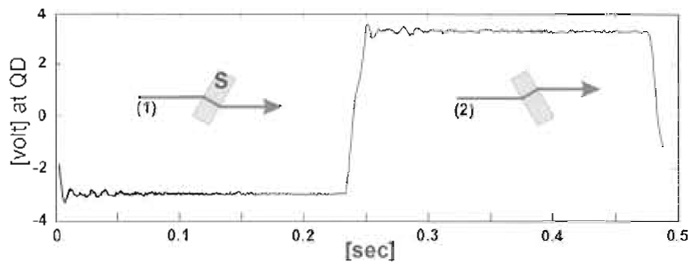
- Transimpedance amplifiers are used to convert the currents from the individual quadrants of the photodetector to voltages. A signal that is almost linearly proportional to, for example, the horizontal bead displacement for movements up to about one-third of a bead diameter is gained by summing the two left-hand and the two right-hand quadrants and taking the difference signal between these values. This signal needs to be converted from volts into bead movement in nanometers. First, it is necessary to convert volts to micrometers movement of the bead image at the quadrant detector by moving the QD to a series of positions with a micrometer-driven slide. Magnification of the microscope from the stage to the quadrant detector then allows conversion of QD volts to bead movement in nanometers. As an accurate calibration using the micrometer is time-consuming, we apply a 2-Hz square wave to a stepper motor to rotate a thin (~0.5 mm) microscope slide ±7.5° so as to give a constant lateral displacement of the bead image (see Fig. 5), which can be measured.
- A variety of methods have been described for measuring the trapping strength, but probably the most robust one for routine use is to apply a square wave to the traps. The bead position record is then averaged over a sufficient number of cycles to give a smooth trace and a rate λ fitted to the exponential decay. The trap stiffness is then 6πrηλ (r being the radius of bead and η the viscosity). It should be noted that η is quite temperature dependent and also that the bulk value is only applicable if the trapped bead is a few bead diameters away from the coverslip. Other methods of measuring trap stiffness have been described by Svoboda and Block (1994).
 |
| FIGURE 5 Calibration using the "flipper" to provide known lateral movement of the bead image. |
A. Assembling the Dumbbell
Preparation of the components is described in Section X. The first step is to trap two beads: if one can be found that has already stuck near to the end of a 5- to 8-mm-long actin filament, so much the better. In the absence of such good fortune, the piezo stage is moved in order to catch a suitable filament near its end. The spacing of the beads is then adjusted to match the filament prior to attaching the loose end by aligning the actin filament using movement of the stage to induce flow past the stationary beads. If the beads and actin filaments have been prepared properly, attachment to the second bead should occur almost instantly because of the constraining influence of the flow. It soon becomes apparent that the correct concentration of beads and actin filaments is critical for successful assembly and use of dumbbells. If there is an inadequate supply of either, too much time is spent searching for beads or actin, if the concentration of one of these is too high, the perfect dumbbell is liable to be spoilt by the capture of extra beads or actin filaments. Due to the effect of radiation pressure, beads enter the trap from the objective side (beads about to be caught look blacker than in their trapped position), which has the fortunate repercussion that the required beads are normally caught ~10µm deep, whereas in the operating position, 1.5µm above the surface of the coverslip, uninvited beads rarely enter the trap. However, actin filaments can float past and become attached. The traps naturally accumulate all forms of small particles that can seriously increase the noise when measuring bead position. All solutions should be filtered and/or centrifuged prior to use.
The success of an experiment is dependent upon the movement of the actin filament being transmitted to the trapped beads, which requires that the compliance between the segment of actin interacting with the myosin and the bead be low compared to that of the myosin head. The compliance of actin itself is low, and the limiting feature is the link between the actin and the bead. The compliance of this link is very nonlinear, and to achieve the required value (>1pN/nm), a significant pretension (>5pN) is necessary. One way of doing this is to align the quadrant detectors, apply a triangular wave to one of the traps, and monitor whether the other bead faithfully follows the first. If not, the dumbbell tension is increased using one of the mirrors m3. One problem is that for a weak trap (0.02 pN/nm) and a 1-µm bead this is quite close to the maximum force. Moreover, the stiffness along the beam (z) axis is several times weaker than the x,y stiffness and is reduced further when the bead is at the edge of the trap. The overall result is that the beads become rather unstable, particularly in the z direction, and the quality of the results is degraded. The application of positive feedback, outlined later, significantly helps limit this problem.
VIII. IMPROVEMENT OF PERFORMANCE
A. Positive Feedback of Bead Position to Trap Position
For a simple trap the maximum force provided by a trap is directly related to its stiffness, with the width of the energy well being controlled by the size of the trapped bead and of the diffraction limited spot. It is advantageous to carry out actomyosin experiments with traps that are considerably more compliant than the myosin head to provide a good contrast in the variance of bead position between periods of actin attachment and detachment, which limits the extent that the dumbbell can be pretensioned to a somewhat suboptimal level. One way to get around this problem is to feedback a fraction α of the bead position to the trap position (Xt = αXb) (Steffen et al., 2001). Such positive feedback broadens the energy well and reduces the stiffness by a factor of α, which allows the intensity of the trapping beam to be increased by this factor to restore the stiffness to its original value. Both the maximum force and the stiffness in the y and, more importantly, the z directions are increased due to this increase in beam intensity. This procedure works well for modest values of α (~2), but considerable care needs to be taken if larger values are used because noise other than that arising from the thermal motion of the bead is also amplified.
The stability of optical microscopes is comparable to the resolution, i.e., slightly submicrometer. The monomer periodicity of actin is 5.5 nm and this will not be resolved unless the stability of the position of the stage with respect to the objective is around the 1-nm level during the period of data collection. This is only possible by servo-controlling the stage position. We have used a combination of piezo-positioned stage and objective, but piezo stages, which have adequate movement in the z as well as the x,y directions, are now available (e.g., Physik Instrumente: P-562.3CD) and are probably the most convenient solution. It is advantageous to bolt the objective directly below the stage so as to minimise thermal drift. Positioning in all three directions can be controlled on the basis of video images, but the noise level is probably slightly lower if an image of the fixed, myosin-bearing bead is projected onto a third quadrant detector to control the x,y position. For most applications, speed of the feedback loop is not the issue. A simple Labview program is available for download from traps.rai.kcl.ac.uk.
IX. ANALYSIS OF DATA
The activity of nonprocessive motors is usually detected on the basis of the reduction of variance of bead position during periods of attachment (Molloy et al., 1995). If both the compliance of at least one of the actin bead links and of the myosin is more than five times the combined stiffness of the traps, at least the longer events will be readily visible on an oscilloscope trace. In these circumstances, detection of events on the basis of reduction of the variance of the bead position is relatively straightforward. We use a program developed by Smith et al. (2001), which carries out a maximum-likelihood analysis of the whole trace and assigns the rates of attachment, f, and detachment, g, as well as the periods of attachment. By comparison of the covariance and autovariance of the bead positions during periods of attachment and detachment, the program also deduces the compliance of the two actin bead links and of the myosin link and corrects the observed working stroke for the effect of these compliances. The core Fortran program and a Matlab program that calls them and analyses batches of files and plots out the most useful aspects of the analysis is available from traps.rai.kcl.ac.uk.
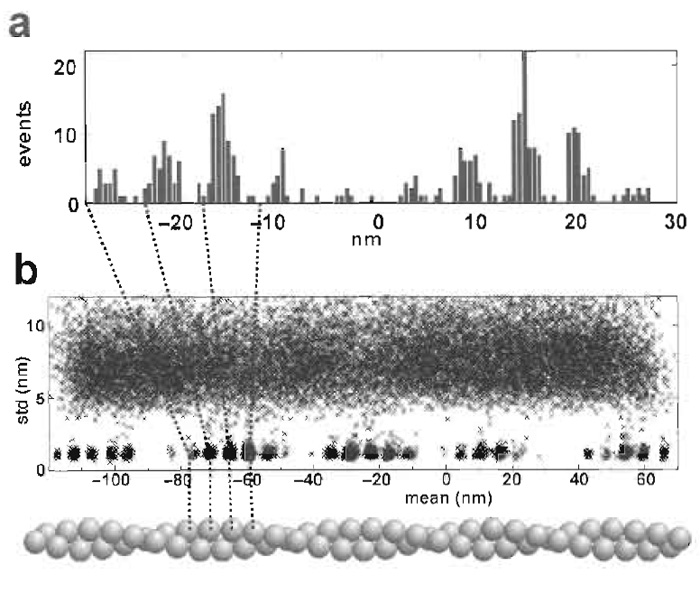 |
| FIGURE 6 (a) Histogram of the position of interactions with a stationary dumbbell and a relatively weak trap so that two target zones are accessed. The myosin is halfway between the two target zones. (b) A plot of the standard deviation versus the mean position of 5-ms time slices of a data record in which the dumbbell is moved past five target zones during the 100s of data collection. |
A. Preparation of Latex Beads
The preparation of neutravidin-coated latex beads is a straightforward procedure and, in our hands, appears to be superior to commercial products. By first generating latex beads covalently cross-linked to biotin, one can generate a stock of beads that can be stored for many months. Once coated with neutravidin the beads are used for a period of 2-3 weeks.
Buffer, Solutions, and Materials
Carboxylated latex beads (Sigma, L3905, 1µm in diameter, 2.5% solids)
Eppendorf reaction vials, screw top
1-Ethyl-3-(3-dimethylaminopropyl) carbodiimide (EDAC) (Sigma, E1769)
50mM phosphate buffer, pH 7.0
2mg/ml biotin-x-cadaverine (Molecular Probe, A1594) in dimethyl sulfoxide, aliquots stored at -80°C
10% NaN3
1M glycine
5mg/ml neutravidin (Molecular Probe, A-2666, aliquots stored at -80°C)
Biotinylated Latex Beads
- Centrifuge 250-µl latex beads in a 1.5-ml Eppendorf reaction vial at 6000g preferably in a swingout rotor (e.g., Sorvall RSA) for 10min.
- Aspirate supernatant without disturbing the pellet.
- Resuspend beads in 500µl of 50mM phosphate buffer, pH 7.0, place in sonicating bath for 10 seconds, and centrifuge as in step 1.
- Repeat washing step. 5. Resuspend beads in 250µl of phosphate buffer, pH 7.0.
- Add 25µl of 2mg/ml biotin-x-cadaverine and vortex.
- Add ~2mg of EDAC cross-linker, mix, and incubate at room temperature for 30min.
- Add 500µl of phosphate buffer and centrifuge as in step 1.
- For the washing step, resuspend beads in 500µl phosphate buffer, sonicate in a bath for 10s, and centrifuge as in step 1.
- Repeat washing step at least five-times.
- After final wash, resuspend beads in 500µl phosphate buffer containing 0.02% NaN3 and store in a refrigerator.
- Resuspend 25 µl of biotinylated 1-µm latex beads (see earlier discussion) in 175µl phosphate buffer.
- Centrifuge at 6000g for 10min.
- Aspirate supernatant.
- Resuspend beads in 100µl of phosphate buffer containing 0.1M glycine.
- Add 15 µl of 5 mg/ml neutravidin and incubate at room temperature for 20min (mix intermittently).
- Add 100µl phosphate buffer and centrifuge as in step 2.
- For the washing step, resuspend beads in 500ml phosphate buffer, sonicate in a bath for 10s, and centrifuge as in step 2.
- Repeat washing step at least five-times.
- After final wash, resuspend beads in 200ml phosphate buffer containing 0.02% NaN3 and store in a refrigerator.
- Test beads in a binding assay (fluorescence microscopy) by mixing beads with 1-4µg/ml biotinylated F-actin at a ratio of 1:50.
F-actin (~50 µM) is modified with a 0.5-1 molar ratio of biotin-PEAC5-maleimide (Dojindo) in a buffer consisting of 10mM NaHCO3, basically as described by Ishijima et al. (1998). It is taken through two depolymerisation cycles before adding 2mg/ml trehalose and flash freezing 10-µl aliquots. An aliquot is polymerised with a small molar excess of tetramethyl rhodamine phalloidin overnight. The next morning, excess dye and any monomeric actin are removed by spinning through 200µl of 10% sucrose (29,000g, 30min: 30,000rpm in Beckman TLA 100.1 rotor) to remove monomeric actin, and the filamentous actin is resuspended with 0.1 mole rhodamine phalloidin per mole of actin.
C. Preparation of Fixed-Bead Microscope Slides (Flow Cell)
To allow myosin to access the actin of the dumbbell, it must be raised above the surface of the cover slip. This is achieved most simply by applying a suspension of 1.5-µm glass beads in a nitrocellulose solution to the coverslip surface.
Steps
- Apply 2µl of glass microspheres (1.5µm) suspended in 0.05% nitrocellulose in amyl acetate to coverslips (#1.5:22 x 22 mm). Spread the suspension evenly using the edge of a second coverslip mounted on a cocktail stick. Allow to dry.
- On a microscope slide lay down two thin strips of vaseline (spacing ~8mm) using a syringe (~22-gauge needle).
- Place nitrocellulose-coated coverslips on top of the slide and press down lightly to produce a gap of about 30µm. (Thick aluminium foil can be used as a spacer.)
- Secure the four corners of the coverslip with Superglue.
Buffers and Solutions
Deoxygenation system (Harada et al., 1990):
1 mg/ml catalase (Sigma, C-100) and
5mg/ml glucose oxidase (Sigma, G7141)
1 mM phalloidin (Sigma, P2141) in methanol, store at -20°C
100 mM N a-ATP
Buffer A: 25 mM K-HEPES, pH 7.6, 25 mM KCl, 4mM MgCl2, 0.02% NaN3
Reaction mix (RM) freshly prepared before every experiment: 1 ml buffer A, 20 µl of 5 mg/ml glucose oxidase, 20µl of 1 mg/ml catalase, 20µl of 100mg/ ml glucose, 1 µl β-mercaptoethanol (BME), 0.5 µl of 1 µM phalloidin, and 1 µM ATP or other nucleotides at concentration of choice
Blocking solution: 1 ml buffer A and 20µl of 50mg/ml bovine serum albumin
Buffer B (make fresh every day):
1 ml buffer A,
1 µl of 1 mM phalloidin, and
2 µl BME
Actin freshly diluted 1:200 in buffer B
10x actin polymerisation buffer: 50mM phosphate, pH 7.5, 500mM K-acetate, 20mM Mg-acetate, and 20 mMNaN3
Procedure
- Add 1-5µg/ml of myosin in buffer B to flow cells and incubate for 1 min.
- Wash out excess myosin with 30µl of buffer B followed by 30µl of blocking solution. Incubate with blocking solution for 1 min.
- Wash with 30ml of buffer B.
- Apply 30µl of final reaction mix containing 1-µl neutravidin-coated latex beads, 1-2nM biotinylated actin, and the chosen concentration of ATP. If the ATP concentration is less than 10µM, addition of a regenerating system (1mM phosphocreatine, 20µg/ml creatine phosphokinase) is advisable.
Finer, J. T., Simmons, R. M., and Spudich, J. A. (1994). Single myosin molecule mechanics: Piconewton forces and nanometre steps. Nature 368, 113-119.
Guilford, W. H., Dupuis, D. E., Kennedy, G., Wu, J., Patlak, J. B., and Warshaw, D. M. (1997). Smooth muscle and skeletal muscle myosins produce similar unitary forces and displacements in the laser trap. Biophys. J. 72, 1006-1021.
Harada, Y., Sakurada, K., Aoki, T., Thomas, D. D., and Yanagida, T. (1990). Mechanochemical coupling in actomyosin energy transduction studied by in vitro movement assay. J. Mol. Biol. 216, 49-68.
Ishijima, A., Kojima, H., Funatsu, T., Tokunaga, M., Higuchi, H., Tanaka, H., and Yanagida, T. (1998). Simultaneous observation of individual ATPase and mechanical events by a single myosin molecule during interaction with actin. Cell 92, 161-171.
Knight, A. E., Veigel, C., Chambers, C., and Molloy, J. E. (2001). Analysis of single-molecule mechanical recordings: Application to actomyosin interactions. Prog. Biophys. Mol. Biol. 77, 45-72.
Lang, M. J., Asbury, C. L., Shaevitz, J. W., and Block, S. M. (2002). An automated two-dimensional optical force clamp for single molecule studies. Biophys. J. 83, 491-501.
Molloy, J. E., Burns, J. E., Kendrick-Jones, J., Tregear, R. T., and White, D. C. (1995). Movement and force produced by a single myosin head. Nature 378, 209-212.
Sheetz, M. P. (1998). Laser tweezers in cell biology: Introduction. Methods Cell Biol. 55, xi-xii.
Smith, D. A., Steffen, W., Simmons, R. M., and Sleep, J. (2001). Hidden-Markov methods for the analysis of single-molecule actomyosin displacement data: The variance-Hidden-Markov method. Biophys. J. 81, 2795-2816.
Steffen, W., Smith, D., Simmons, R., and Sleep, J. (2001). Mapping the actin filament with myosin. Proc. Natl. Acad. Sci. USA 98, 14949-14954.
Svoboda, K., and Block, S. M. (1994). Biological applications of optical forces. Annu. Rev. Biophys. Biomot. Struct. 23, 247-285.
Visscher, K., Brakenhoff, G. J., and Krol, J. J. (1993). Micromanipulation by "multiple" optical traps created by a single fast scanning trap integrated with the bilateral confocal scanning laser microscope. Cytometry 14, 105-114.
Support our developers


