Total Internal Reflection Fluorescent Microscopy
A. Overview and Applications
Total internal reflection fluorescent microscopy (TIRFM), also called evanescent wave microscopy, selectively excites fluorophores in a very thin (<100nm) optical plane near the cell/coverslip interphase; the intensity of this evanescent field drops off exponentially away from the coverslip (Axelrod, 2003). The net effect is that there is virtually no out-of-focus background fluorescence and the vertical resolution and signal-to-noise are excellent, unmatched by any other light microscopy technique. These attributes make TIRFM ideal for sensitive and quantitative imaging of processes near the ventral (or basal) cell surface. The advent of a multicolor pallet of green fluorescent proteins tags (e.g., CFP, GFP, YFP, and dsRed) and other fluorophores (e.g., FlAsH), new very high numerical aperture (NA) lens, and "turn-key" commercial TIRFM systems has made TIRFM increasingly popular with cell biologists.
http://www.olympusmicro.com/primer/techniques/fluorescence/tirf/tirfhome.html.
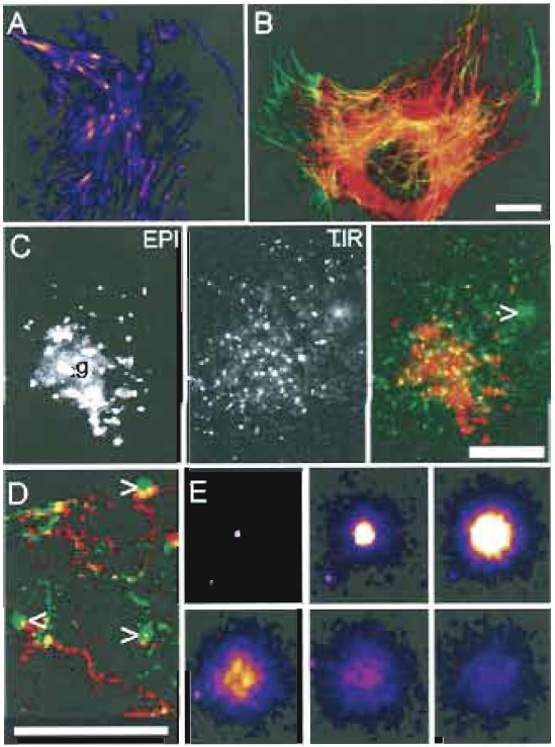 |
| FIGURE 1 Images of cell cytoskeleton and membrane traffic with TIRFM. (A and E) Images of the TIR fluorescent signal that have been false colored; bright to dimmest signal is white > yellow > red > purple. (B-D) The normal epifluorescent signal (EPI) is colored red and the TIR fluorescent signal (TIR) is shown in green. All images are from PtK2 epithelial-like cells labeled with various YFP constructs. (A) Actin-YFP. Note that the ends of stress fibers (likely focal adhesions) are particularly bright. (B) Tubulin-YFP. Tubulin near the coverslip is yellowish-green. Note that single microtubules can be observed clearly by TIRFM (green) even under dense areas of microtubules (red). (C) Different views of membrane cargo. VSVG-YFP, a membrane protein, was accumulated in the Golgi (g) and then released. The cursor indicates a vesicle that has just fused with the plasma membrane (PM). Note that EPI and TIR images of the cell are very different (even though the focal plane was not changed). In EPI the Golgi area is stained brightly, whereas in TIR vesicles near the membrane are brightest; there is weak PM staining due to VSVGYFP that has already fused. (D) Tracking trafficking and fusion. A series of ~200 frames were back subtracted and the difference image was projected. Vesicles that moved out gave a red EPI "track," turned yellow/green as they approached the membrane, and fusion itself gave a green circular "flash," indicated by the cursors. (E) Collage of a vesicle undergoing fusion. Starting in the top left, 1 sec intervals are shown from left to right. The fading of the signal in frames 4-6 is due to lateral diffusion of protein in the membrane. All images were taken with a TIRFM microscope similar to that in Fig. 4A, but with a hemicylinder prism. Scale bars: 5µm (B-D) and 2µm width of Box in (E). Reprinted from Toomre and Manstein (2001). |
B. Theoretical Principles
The following is a condensed summary of total internal reflection (TIR) theory; for brevity, specialized properties of TIR illumination, such as the effects of polarized light and the use of metal films for creating surface plasmon resonance effects, can be found elsewhere (Axelrod, 2003; Sund et al., 1999).
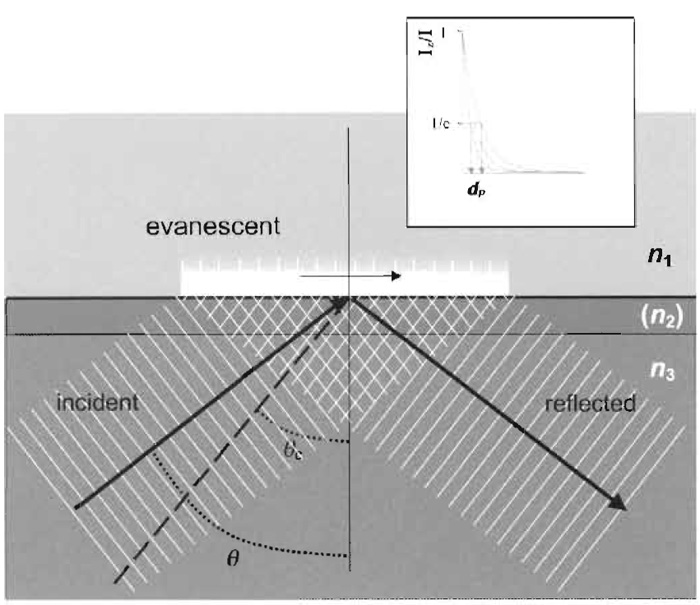 |
| FIGURE 2 Geometrical scheme of TIR. Refractive index n3 must be greater than n1. The intermediate layer (consisting of metal or a dielectric material of refractive index n2) is not necessary for TIR to occur, but can introduce useful optical properties. Most applications of TIRFM do not use an intermediate layer. The incidence angle θ must be larger than the critical angle θc for TIR to occur. The exponentially decaying evanescent field in the n1 material is used to excite fluorophores. The inserted box shows examples of exponential decay curves of the intensity of the evanescence field at various penetration depths (d). Adapted from Axelrod (2003). |
| θc=sin-1(n1/n3) |
where n1 and n3 are the refractive indices of the liquid and solid, respectively. In the example with cells attached to glass, θc = 64.2° (if n1~1.36). In reality, there is often a thin intermediate layer(s) such as the cellular plasma membrane (n2), but for many purposes these can be disregarded as the effects are often nominal (Axelrod, 2003).
| I(z) = I(O)e-z/d | where | 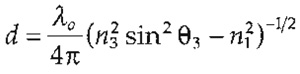 |
C. Advantages of TIRFM over Confocal Microscopes
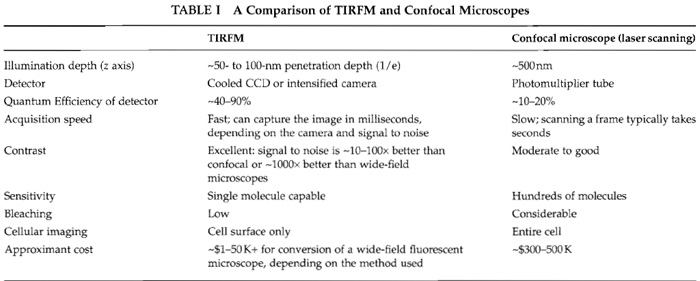
A principal advantage of TIRFM is excellent signal to noise, achieved by limiting the illumination to a thin focal plane. High-contrast images can be imaged quickly with minimal photobleaching. In contrast, confocal laser scanning microscopes are slower and less sensitive, but can image the entire depth of the cell, one slice at a time (Table I).
 |
II. MATERIALS AND INSTRUMENTATION
A. Illumination
In practice, most TIRFM systems employ lasers, which allow for an intense colliminated beam of light. Typically lasers that provide 10s to 100s of milliwatts per line(s) of interest are used. For imaging GFP proteins, an air-cooled argon laser (e.g., 100mW, 488nm, Melles Griot) or, alternatively, an optically pumpeddiode laser (e.g., "Sapphire", 20-200mW, 488nm, Coherent) can be used; multicolor samples generally require stronger lasers to "pick" a weaker line or multiple lasers coupled with dichroic filters. In some configurations, mentioned later, an arc lamp may be feasible.
The beam of laser light must be redirected to the microscope (prism or objective) and focused. Traditionally, an optical chain of mirrors and lens are employed, requiring an "optical table." An alternative is to couple the light into a single mode fiber optic, providing a more flexible configuration (the laser need not be on the optical table and the fiber can be positioned easily). The fiber is generally coupled to a focusing lens or TIR condenser. A set of XY 1 and possibly Z micro-manipulaters are used to control the angle and position of the beam (e.g., where it strikes the prism or the back focal plane of the objective).
1 For convention here, the Z axis is parallel to the laser and optical axis and XY is perpendicular to it.
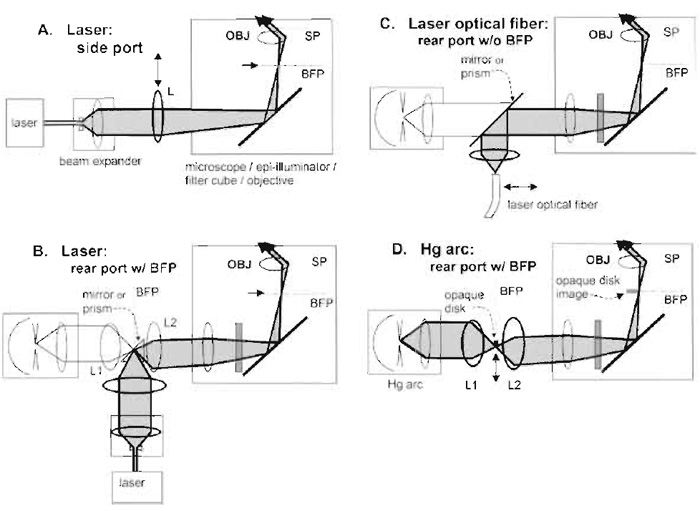 |
| FIGURE 3 Four arrangements for objective-type (prismless) TIRFM in an inverted microscope. In all these configuration, OBJ refers to the objective, SP refers to sample plane, and BFP refers to the objective's back focal plane or its equivalent or "aperture" planes. Components drawn with heavier lines need to be installed; components in lighter lines possibly preexist in the standard microscope. (A) Laser illumination through a side port (requires a special dichroic mirror cube facing the side, available for the Olympus IX-70 microscope). The beam is focused at the back focal plane at a radial position sufficient to lead to supercritical angle propagation into the coverslip. Moving the focusing lens L transversely changes the angle of incidence at the sample and allows switching between subcritical (EPI) and supercritical (TIR) illumination. (B) Laser illumination in microscope systems containing an equivalent BFP in the rear path normally used by an arc lamp. The laser beam is focused at the BFP where the arc lamp would normally be imaged. The Zeiss Axiovert 200 provides this BFP, marked as an "aperture plane." If (as in the Olympus IX-70) an aperture plane does not exist in the indicated position, it can be created with the pair of lens L1 and L2. (C) Laser illumination introduced by an optical fiber through the rear port normally used by the arc lamp. This scheme is employed in the commercial Olympus TIR device. (D) Arc lamp TIR illumination with no laser at all. The goal is to produce a sharp-edged shadow image of an opaque circular disk at the objective back focal plane such that only supercritical light passes through the objective. The actual physical opaque disk (made ideally of aluminized coating on glass) must be positioned at an equivalent upbeam BFP, which, in Kohler illumination, also contains a real image of the arc. The Zeiss Axiovert 200 provides this BFP, marked as an "aperture plane." If (as in the Olympus IX-70) an aperture plane does not exist in the indicated position, it can be created with the pair of lens L1 and L2. Illumination at the back focal plane is a circular annulus; it is shown as a point on one side of the optical axis for pictorial clarity only. Adapted from Axelrod (2003). |
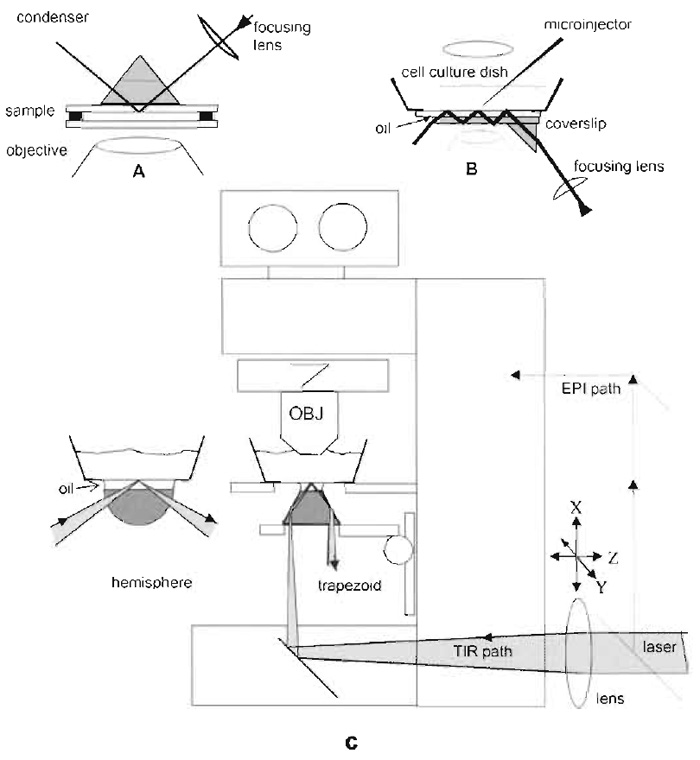 |
| FIGURE 4 Schematic drawings for prism-based TIRFM using a laser as a light source. The vertical distances are exaggerated for clarity. (A) This configurations uses a TIR prism above the sample. The bufferfilled sample chamber sandwich consists of a lower bare glass coverslip, a spacer ring (made of 60µm-thick Teflon or double-stick cellophane tape), and the cell coverslip inverted so the cells face down. The upper surface of the cell coverslip is put in optical contact with the prism lowered from above by a layer of immersion oil or glycerol. The lateral position of the prism is fixed but the sample can be translated while still maintaining optical contact. The lower coverslip can be oversized and the spacer can be cut with gaps so that solutions can be changed by capillary action with entrance and exit ports. (B) This configuration places the prism below the sample and depends on multiple internal reflections in the substrate, thus allowing complete access to the sample from above for solution changing and/or electrophysiology studies. However, only air or water immersion objectives may be used because oil at the lower surface of the substrate will thwart the internal reflections. (C) TIRFM on an upright microscope utilizing the integral optics in the microscope base and a trapezoidal prism on the vertically movable condenser mount. The position of the beam is adjustable by moving the external lens. An alternative hemispherical prism configuration for variable incidence angle is also indicated to the left. Vertical distances are exaggerated for clarity. An extra set of mirrors can be installed to deflect the beam into an epi-illumination light path (shown with dashed lines). Adapted from Axelrod (2003). |
C. TIRFM Optical Configurations
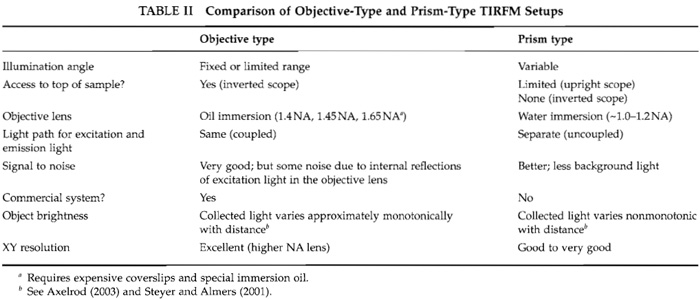
There are basically two kinds of TIRFM setups: an "objective type" (also called "prismless") and a "prism type." Both can be mounted in numerous configurations; for simplicity, a few common configurations are shown in Figs. 3 and 4. Both setups have advantages and disadvantages as outlined in Table II.
 |
The recent development of very high NA objectives has made objective-type TIRFM feasible. The microscope can be configured in several variations by use of commercial accessories or straightforward modifications (e.g., Fig. 3). To achieve TIR, a beam of light, usually from a laser, is focused off-axis at the back focal plane (BFP) of the objective. The greater the off-axis radial position of the focus, the greater the angle of incidence θ3 of the beam in the glass. The maximal angle of incidence, θm (≥θ3) , depends on the NA of the objective (by definition NA = noilsin θm). Snell's law (n3sinθ3 = n1sinθ1) leads NA ≥ n1sinθ1. At the critical angle, θc, θ1 = 90° and thus NA ≥ n1. In the cellular context, for TIR to occur, we must have NA > ncytosol. For a 1.4 NA oil lens and ncytosol = 1.38, only a very thin cone at the outer edge of the back focal plane of the objective barely (<3% of the aperture) allows TIR excitation. (Of course, the whole aperture is still used to gather emitted light.) Practically, TIR is easier to obtain with 1.45 and 1.65 NA objectives that allow 0c to be surpassed more easily and TIR can occur in ~10 and 25% of the aperture, respectively.
An arc-lamp illumination system can also be configured for TIRFM illumination by use of an opaque disk of the correct diameter inserted in an "upbeam" plane equivalent of the BFP of the objective (Fig. 3D). It is less expensive, gives freedom in the choice of excitation wavelengths, and avoids interference fringes, but it is considerably dimmer as much of the excitation light is necessarily blocked; this can be improved somewhat by employing a conical prism in the arclamp light path (Axelrod, 2003).
- Microscope: usually inverted (this allows complete access to the cells). Objectives: high NA "TIRFM" objective(s), typically 1.45-1.65NA, 60-100× magnification: currently available from Olympus, Zeiss, and Nikon (1.65NA only from Olympus).
- 1.45NA objectives use regular #1.5 coverslips (n = 1.52), possibly premounted in a 30-mm petri dish (e.g., Mattek, Ashland, MA).
- 1.65NA objective requires "special" high refractive index oil (n = 1.78), really iodomethane, that is volatile and potentially toxic (Cargille, USA). Similarly, high refractive index coverslips are needed, e.g. n = 1.78 coverslips made of LAFN21 glass (Olympus) or SF11 glass (custom cut by VA Optical Co, San Anselmo, CA). Unfortunately, such coverslips are expensive (>$20/coverslip), fragile, and practically are only reusable a few times. It is, however, a good choice when a thin d is needed.
- Filters: dichroic filters and emission filters appropriate for the laser line(s): These must block scattered light from the laser and generally require high bandpass filters (e.g., Chroma Corp., USA).
- Optional: commercial objective-type TIRFM condensers are available from Till Photonics, Olympus, Zeiss, and Nikon for mounting to their respective microscopes. Generally lasers are coupled into them via a fiber optic.
- Focus the laser beam (using an external focusing lens) to a point on the BFP of a high NA objective (1.45-1.65 NA) so that it emerges from the objective as a collimated "beam" of light,
(Caution: Use safety glasses.) - Using XY micromanipulators adjust the point of focus radially off-axis in the BFP so as to achieve TIR (see protocol later). There is a one-to-one correspondence between the off-axis radial distance ρ and the angle 0. At a sufficiently high ρ, the critical angle for TIR can be exceeded; further increases in ρ reduce the penetration depth, d.
Materials
- Microscope (upright will provide some access to sample)
- ~1.0-1.25 NA water immersion objective (~20×-60×). If access to the sample is desired, a long working distance "dip-in" objective may be best.
- Prism: triangular, trapezoidal, or hemispherical, depending on the setup. Equilateral prisms made from flint glass (n = 1.648) are available commercially (Rolyn Optics, USA) and will provide a sufficiently high n for TIR to occur at the aqueous interface. A hemispherical prism (e.g., quartz) allows for variable incidence angles over a continuous range but requires external optical elements (vertical optical rail with XYZ translators).
- A mount for holding and positioning (XY) the prism (see Fig. 4)
- Dichroic filters and emission filters appropriate for the laser line(s): These must block the scattered or propagating laser light (usually less than in "objectivetype" setups)
- Cells are usually grown on disposable glass coverslips/ slides, but more exotic high n3 materials such as sapphire, titanium dioxide, and strontium titanate (with n as high as 2.4) can yield exponential decay depths d as low as λo/20.
- Optical coupling of prism to coverslip/slide: This may be optically coupled with glycerol, cyclohexanol, or microscope immersion oil, among other liquids, and need not exactly match in refractive index.
Figures 4A and 4B show representative schematic drawings for setting up prism-based TIR in an inverted microscope. Figure 4C shows a convenient low-cost prism-based TIRFM setup for an upright microscope. Specifically, the laser beam is introduced in the same port in the microscope base as intended for the transmitted light illuminator (which should be removed), thereby utilizing the microscope's own in base optics to direct the beam vertically upward. The prism, in the shape of a trapezoid, is mounted on the microscope's condenser mount, in optical contact (through a layer of immersion oil) with the underside of the glass coverslip. An extra lens, just upbeam from the microscope base, allows the incident beam to be adjusted to totally reflect off one of the sloping sides of the prism, from which the beam continues up at an angle toward the cells grown on the coverslip where it is weakly focused.
In all the prism-based methods, the TIRF spot should be focused to a width no larger than the field of view and θ should exceed θc by at least a couple of degrees. At incidence angles very near θc, the cells cast a noticeable "shadow" along the surface.
C. Camera
A good cooled CCD camera should be adequate for most TIRFM imaging of cells. For instance, current "extended range" (ER) front-illuminated CCD cameras have quantum efficiencies up to ~65% (available from Hamamatsu, PCO, Roper, etc.). Backthinned cameras are more sensitive but generally slower and more expensive. Intensified or electron multiplying (EM) CCD cameras are typically used for rapid single molecule imaging (Pierce, 1999).
Cells grown on coverslips are placed in cell imaging chamber (e.g., Mattek dishes with glued in coverslip). Focus drift along the z axis can be problematic, especially when heating cells to 37°C, as even minor drifts are very noticeable in TIRFM. To minimize drift, an environmental chamber or heated "plexiglass" box is helpful. A number of commercial based ones are available; however, this can also be homebuilt for much less using a "Air-therm" (World Precision Instruments; England) or similar hot-air blower and a self-built box. Another solution is to use an active autofocusing device connected to a piezoelectric device.
III. PROCEDURES
Caution! The use of lasers should be considered potentially hazardous to the eyes and proper laser safety should be followed. Precautions include (but not limited to) using appropriate laser safety glasses/goggles, attenuating the laser power while making adjustments, never looking directly into the beam or its reflections, and not looking into the eyepiece unless adequate dichroic and emission filters are in place (and even then use extreme caution). Indirect imaging of the beam and sample image can be accomplished with CCD cameras and is much safer.
This description is for the setup in Figs. 3A-3C, but is similar for other configurations.
- Prepare a test sample consisting of a film of fluorescent lipid adsorbed to the coverslip. Dissolve dioctadecylindocarbocyanine ("diI"; Molecular Probes) in ethanol at ~0.5mg/ml, place a droplet on the coverslip, and rinse with distilled water before it dries and a diI monolayer will remain on the coverslip. When excited at 488nm and observed with a fluorescein dichroic and "long-pass" emission filter, the diI will appear orange. Add an aqueous dilute fluorescein solution (faint yellow) to the sample chamber, which will emit in green. Alternatively, add an aqueous suspension of fluorescent microbeads (~100nm diameter, 488nm, Molecular Probes, USA). Some of the beads will adhere to the surface, whereas bulk suspended beads will jitter with Brownian motion.
- Carefully place a drop of immersion oil on the objective lens, set the sample on the microscope stage, and slowly raise the objective to establish optical contact.
- Remove the excitation filter from the filter cube if it were present for arc illumination, leaving only the appropriate dichroic and emission filters, or instead use a laser "clean-up" excitation filter (e.g., laser line wavelength ± ~10nm; Chroma).
- Remove all obstructions between the test sample and the ceiling. Allow a collimated "raw" laser beam to enter the side or rear epi-illumination port along the optical axis. A large area of laser illumination should be seen on the ceiling, roughly straight up. (Make sure to keep your eyes out of the laser beam path! Ideally use laser safety glasses.)
- Place a focusing lens (~100mm focal length plano- or double-convex lens mounted on a XY microtranslator) at a position ~about 20 cm "upbeam" from where the beam enters the microscope illumination port. The illuminated region on the ceiling will now be a different size, probably smaller.
- Move the focusing lens longitudinally (along the z axis) to minimize the illuminated region on the ceiling. This will occur where the converging lens focal point falls exactly at the objective's back focal plane. At this position, the beam is thereby also focused at the objective's actual back focal plane and emerges from the objective in a roughly collimated form.
- Fine tune the lateral position of the focusing lens so that (as you face the microscope) the beam spot on the ceiling moves down a wall to the right or left. The inclined path of the beam through the fluorescent aqueous medium in the sample will be obvious to the eye. Continue to adjust the focusing lens lateral position until the beam traverses almost horizontally through the fluorescent medium and then farther, past where it just disappears. The beam is now totally reflecting at the substrate/aqueous interface.
- Carefully view the sample through the microscope eyepieces (or with a color CCD camera). The diI/fluorescein sample should appear orange, not green, as only the surface is being excited; the beads should look like high contrast immobilized dots, occasionally some will "blink" as they diffuse into and out of the evanescent field. Back off the focusing lens to where the beam reappears in the sample (i.e., subcritical incidence). When viewed through the eyepieces, the diI/fluorescein sample should now appear very bright green or beads will have lots of background as they jiggle through multiple focal planes and emit outof- focus light.
- If the illuminated region in the field of view is not centered, adjust the lateral position of the "raw" laser beam before it enters the focusing lens and repeat Steps 7 and 8. If the illuminated region thereby approaches the center, continue to readjust the raw beam in the same direction and repeat the steps until centering is achieved. If the illuminated region moves even farther to the side, then adjust the raw beam in the opposite direction and repeat the steps. The final position will be a laser beam entering the focusing lens parallel to its optical axis but somewhat off center.
- If the illuminated region is too small, increase the width of the beam before it enters the focusing lens with a beam expander or long focal length diverging lens. At best, about two-thirds of the whole field of view can be illuminated by TIR (which includes the entire central region typically viewed by a CCD camera).
- Replace the test sample with the sample of interest and focus the microscope. As the lateral position of the external focusing lens is adjusted through the critical angle position, the onset of TIR fluoresence should be obvious as a sudden darkening of the background and a flat two-dimensional look to the features near the surface. Importantly the entire field of view has only one plane of focus. A good control is to take one image by TIR and then, without adjusting the focus, take another fluorescent image by conventional epiillumination (see Fig. 1). For most cellular objects, these two images, when overlaid, should look very different. As one's experience increases, the test sample can be skipped and all the adjustments made directly on the actual sample of interest (although this can be tricky if, say, there are only a few transfected GFP cells that one must "hunt" down).
This description is for the setup in Fig. 4C, but is basically similar for other configurations.
- Mount the prism on the condenser mount carrier, if possible. Alternatively, the prism holder can be fixed directly to the optical table or microscope.
- Depending on the configuration, a system of mirrors with adjustable angle mounts fixed to the table must be used to direct the beam toward the prism.
- Place a test sample (e.g., a diI-coated coverslip and fluorescein or bead solution; see earlier) in the same kind of sample holder as to be used for real cellbased experiments.
- With the test sample on the stage, focus on the fluorescent surface with bright-field or fluorescent epi-illumination. Usually, dust and defects can be seen well enough to find the focal plane by the coverslip/ medium interface.
- Place a small droplet of immersion oil directly on the prism and carefully translate the prism vertically so it touches and spreads the oil, but does not inhibit lateral sliding; too much oil may interfere with the illumination path.
- Rough adjustments: Using safety goggles to attenuate errant reflections and without the focusing lens in place, adjust the "raw" collimated laser beam position with the mirrors so that TIR occurs directly in line with the objective's optical axis, as seen from the scatter of the laser light as it traverses through the prism, oil, and TIR surface.
- Insert the focusing lens so that the focus is roughly at the TIR area under observation. By eye, using XY translators on the focusing lens, adjust its lateral position so that the TIR region occurs directly in line with the objective. Look for three closely aligned spots of scattered light, corresponding to where the focused beam first crosses the immersion oil layer, where it totally reflects off the sample surface, and where it exits and recrosses the oil.
- Fine adjustments: The yellow-orange TIR elliptical region should now be in view but not centered. Make final adjustments with the focusing lens (XY) to center this area and move it along the z axis to achieve the desired size. TIR can be distinguished from two out-of-focus blurs past either end of the ellipse. The TIR spot contains sharply focused images of defects in the diI coating or sharp dots of adsorbed beads and flashes as diffusing beads drift into the evanescent wave; as a negative control the green-emitting fluorescein is hardly seen.
- With the optics now aligned correctly for TIR, lower the prism vertically to remove the diI sample and replace it with the actual cell sample. Raise the prism to make optical contact. Although the TIR region will be slightly off, it will be close enough to make final adjustments while observing fluorescent cells.
- A "homebuilt" TIRFM system can be ideal in terms of flexibility and cost; however, commercial "turn-key" systems may be quicker or easier to implement.
- Even "thick cells" can be imaged by TIRFM, but one will only "see" where the cell contacts the coverslip. In theory, it is sometimes possible to image deeper in the cell if there is a big refractive index difference of organelles/membranes, but in practice this is rarely implemented. Also, if the penetration is too deep (e.g., past 150nm), higher refractive index organelles such as granules can scatter the TIR light, producing artifacts.
- TIRFM is different from the nonfluorescent technique called "reflection internal microscopy" (RIM or also IRM) that uses bright-field illumination to visualise cell-substrate contacts.
A common problem is adjusting the system so that a homogeneous evanescent field is achieved. If alignment on a single mode fiber is off, output light may give a speckled appearance from hitting the cladding and will require realignment. Laser illumination can produce interference fringes, manifested as intensity variations over the sample area. In this case, it may be advisable to scramble the light (e.g., in a commercially optical fiber phase scrambler).
References
Axelrod, D. (2001). Total internal reflection fluorescence microscopy in cell biology. Traffic 2, 764-774.
Axelrod, D. (2003). Total internal reflection fluorescence microscopy in cell biology. Methods Enzymol 361, 1-33.
Ishijima, A., and Yanagida, T. (2001). Single molecule nanobioscience. Trends Biochem. Sci. 26, 438-444.
Johns, L. M., Levitan, E. S., Shelden, E. A., Holz, R. W., and Axelrod, D. (2001). Restriction of secretory granule motion near the plasma membrane of chromaffin cells. J. Cell Biol. 153, 177-190.
Nishida, S., Funabashi, Y., and Ikai, A. (2002). Combination of AFM with an objective-type total internal reflection fluorescence microscope (TIRFM) for nanomanipulation of single cells. Ultramicroscopy 91, 269-274.
Oheim, M. (2001). Imaging transmitter release. II. A practical guide to evanescent-wave imaging. Lasers Med. Sci. 16, 159-170.
Pierce, D. V. R. D. (1999). Single-molecule fluorescence detection of green fluorescent protein and application to single proteins dynamics. Methods Cell Biol. 58, 49-73.
Sako, Y., and Uyemura, T. (2002). Total internal reflection fluorescence microscopy for single-molecule imaging in living cells. Cell Struct. Funct. 27, 357-365.
Starr, T. E., and Thompson, N. L. (2001). Total internal reflection with fluorescence correlation spectroscopy: Combined surface reaction and solution diffusion. Biophys. J. 80, 1575-1584.
Steyer, J. A., and Almers, W. (2001). A real-time view of life within 100nm of the plasma membrane. Nature Rev. Mol. Cell Biol. 2, 268-275.
Sund, S. E., Swanson, J. A., and Axelrod, D. (1999). Cell membrane orientation visualized by polarized total internal reflection fluorescence. Biophys. J. 77, 2266-2283.
Toomre, D., and Manstein, D. J. (2001). Lighting up the cell surface with evanescent wave microscopy. Trends Cell Biol. 11, 298-303.
Vale, R. D., Funatsu, T., Pierce, D. W., Romberg, L., Harada, Y., and Yanagida, T. (1996). Direct observation of single kinesin molecules moving along microtubules. Nature 380, 451-453.
Zenisek, D., Steyer, J. A., and Almers, W. (2000). Transport, capture and exocytosis of single synaptic vesicles at active zones. Nature 406, 849-854.
Support our developers


