Polymerase Chain Reaction-Based Amplification Method of Retaining the Quantitative Difference between Two Complex Genomes
Technologies for analyzing gene expression and gene copy number changes are increasingly used in the detection, diagnosis, and therapy of cancer. The clinical outcome of various breast cancer therapies correlates closely with distinct mRNA expression profiles detected using DNA microarrays (Alizadeh et at., 2001; Perou et at., 1999; Ross and Perou, 2001; Sorlie et at., 2001; van't Veer et at., 2002). Array-based comparative genomic hybridization (array-CGH) can detect the amplification or deletion of candidate breast cancer genes as well as genomic instability within tumor cells (Albertson et at., 2000; Kallioniemi et at., 1992, 1994; Pinkel et at., 1998; Pollack et at., 1999). Subtractive hybridization methods, such as differential display or representational difference analysis, are also used for breast cancer gene discovery (Scheurle et at., 2000). Such genetic profiling-based diagnosis can potentially revolutionize the existing staging system and the management of early breast disease (Burki et at., 2000). However, analysis of genetic changes in tumors using these techniques requires "µgs" of pure tumor DNA (Klein et at., 1999; Lucito et at., 1998). Routine tumor biopsies often consist of inhomogeneous mixtures of stromal cells plus tumor cells with a wide range of genetic profiles (Rubin, 2002). Newer techniques, such as fine needle aspiration (FNA) and laser capture microdissection (LCM), allow for the removal of minute amounts of tissue from tumors (Rubin, 2002). LCM can isolate homogeneous populations of normal or tumor cells, potentially resolving tissue into single cells (Assersohn et at., 2002; Emmert-Buck et at., 1996). However, the yield of RNA/DNA from small cell numbers dictates that LCM must be coupled to a DNA amplification step, usually by use of the polymerase chain reaction (PCR) (Assersohn et at., 2002).
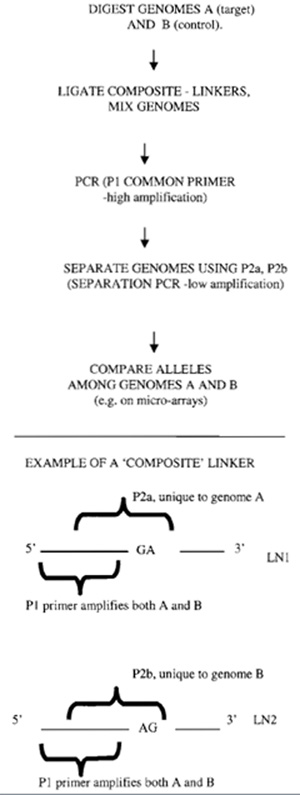 |
| FIGURE 1 Outline of balanced PCR amplification of cDNA or genomic DNA. Reproduced with permission from Nature Publishing Group. |
A major problem with PCR is that amplification occurs in a nonlinear manner and reproducibility is influenced by stray impurities (Heid, 1996). The exponential mode of DNA amplification and concentration-dependent PCR saturation are notorious for introduction of bias (Heid, 1996). As a result, when amplifying two complex DNA populations, the quantitative relationship between two genes after amplification is generally not the same as their relation prior to amplification. Real-time PCR strategies can retain the initial relation among alleles when a single gene is amplified from two sources (Celi et at., 1994). Further, methods exist to PCR amplify whole genomic DNA from as little as a single cell (Klein et at., 1999; Nelson et at., 1989; Zhang et at., 1992). However, the quantitative amplification of the entire population of DNA fragments ("alleles") from two different complex genomes is not possible using conventional PCR. Multiple strand displacement isothermal amplification (MDA) is an alternative to PCR that has shown promise in a number of investigations (Dean et at., 2002; Zhang et at., 1992). However, MDA requires long DNA stretches to work effectively and therefore it is inefficient when formalin-fixed, archival genomic DNA is to be amplified (Lage et at., 2003) or when cDNA amplification for gene expression profiling on microarrays is required.
We have described balanced PCR (Makrigiorgos et at., 2002), a method that overcomes biases associated with PCR amplification of complex genomes and faithfully retains the difference among corresponding genes, or gene fragments over the entire sample. This approach, which can be applied to the amplification of both genomic DNA and cDNA, utilizes a simple principle (Fig. 1). Two distinct genomic DNA samples, a "target" sample and a "control" sample, are tagged with oligonucleotides (LN1, LN2) containing both a common (P1) and a unique DNA sequence (P2a, P2b). The genomic DNA samples are pooled and amplified in a single PCR tube using the common DNA tag, P1. By mixing the two genomes, PCR "loses" the ability to discriminate between the different alleles and the influence of impurities tends to cancel. The PCRamplified pooled samples can subsequently be differentially labeled or separated using the DNA tag unique to each individual DNA sample. This balanced PCR approach has been validated with amplification of cDNA for gene expression profiling (Makrigiorgos et at., 2002) and genomic DNA for array CGH profiling (Wang et at., submitted for publication).
II. MATERIALS
NlaIII (Cat. No. R0125S), DpnII (Cat. No. R0543S), Sau3A (Cat. No. R0169S), and T4 DNA ligase (Cat. No. M0202T) are from New England Biolabs. Advantage 2 PCR kit (K1910-1) and TITANIUM Taq PCR kit (K1915- 1) are from BD Biosciences. RNeasy minikit (Cat. No. 74104) and QIAquick PCR purification kit (Cat. No. 28104) are from Qiagen. The SuperScript doublestranded cDNA synthesis kit (Cat. No. 11917-020) is from Invitrogen. Picogreen dsDNA quantitation reagent (P-7581) is from Molecular Probes. Linkers are synthesized from Oligos Etc. PCR reactions are performed with a TechGene thermocycler (TECHNE).
A. Double-Strand cDNA Synthesis
The protocols recommended by the manufacturers were used to extract total RNA from breast or prostate cells (RNeasy minikit), to reverse transcribe to cDNA using Oligo(dT)12-18 primers, and to synthesize doublestranded cDNA (SuperScript double-stranded cDNA synthesis kit).
B. Balanced PCR Protocol
This procedure is a modification of the one originally reported (Makrigiorgos et at., 2002) and can be used for amplification of either cDNA or whole genomic DNA. The procedure has been tested with starting amounts of 1-10ng total mRNA and with 1-10ng of total genomic DNA extracted from target (e.g., tumor) and control (e.g., normal tissue) cells.
- Digestion. The protocol described here employees either NlaIII or DpnII/Sau3A for double-stranded cDNA digestion. Mix 1µl of 10ng/µl cDNA from the target cells (e.g., tumor) or from the control cells (e.g., normal tissue) with 0.5µl of 10x T4 DNA ligase buffer, 0.5 µl of 10U/µl NlaIII/DpnII/Sau3A, and 3 µl of H2O. Incubate this mixture at 37°C for 1h.
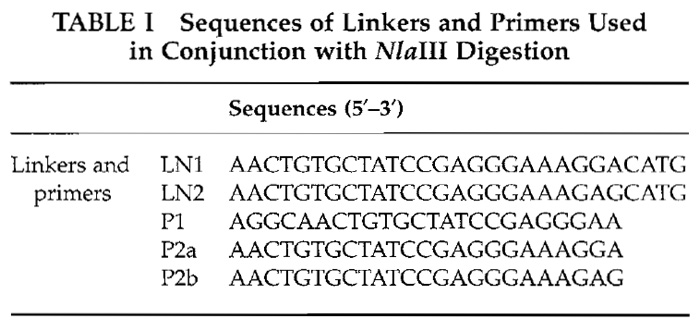
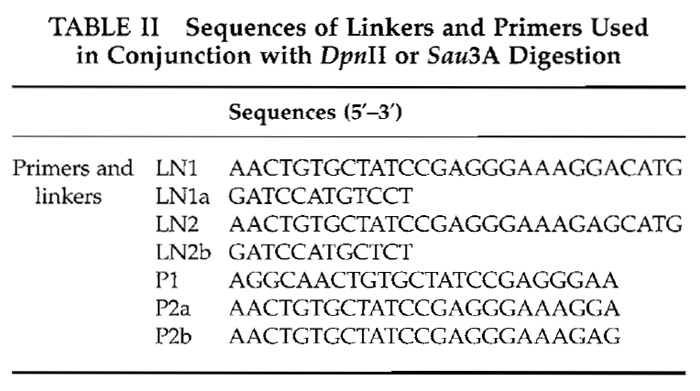
- Ligation. Add 0.5 µl of 10x ligase buffer, 0.3 µl of 2.8 µg/µl linker, and 3.7 µl H2O into digestion solution. For digestion with NlaIII, linker LN1 is used for control and LN2 for target cDNA (Table I). For digestion with DpnII or Sau3A, linker LN1 and an equimolar amount LN1a are used for ligation to the control cDNA; and linker LN2 and an equimolar amount of LN2a are used for ligation to the target cDNA (Table II). Anneal the appropriate linkers to cDNA by serially decreasing temperature of the sample from 50 to 10°C at 5°C ramp in 5-min steps. Then add 0.5µl of 2000U/µl T4 DNA ligase and incubate at room temperature for 1h.
- Purification. Mix together cDNAs ligated to different linkers and purify the mixture with a QIAquick PCR purification kit. Purification is not needed if only a fraction of the ligation mixture (e.g., 10% of the total volume) is used in the subsequent coamplification PCR reaction.
- Coamplification PCR. To 20 µl of purified-ligated DNA, add 5µl of 10x Advantage 2 PCR buffer, 1µl of 50x Advantage 2 polymerase mix, 1µl of 50x dNTP mix (10mM each), 1µl of 10µM common primer P1, and 22µl of H2O. Perform PCR at 72°C for 8 min; 95°C for 1 min; 20 cycles of 95°C for 30s; 72°C for 1 min; and then 72°C for 5 min. Purify the PCR product twice with QIAquick PCR purification kit and elute the DNA in 50µl of H2O. Quantify cDNA concentration with Picogreen. This procedure usually yields 2-3 µg cDNA from an original material of ~5 ng cDNA.
- Separation. Mix 1µl of 3ng/µl DNA with 5µl of 10x TITANIUM Taq PCR buffer, 1µl of 50x TITANIUM Taq polymerase, 1µl of 50x dNTP Mix (10mM each), 5 µl of 4 µM P2a for LN1-ligated cDNA or P2b for LN2- ligated cDNA, and 37 µl of H2O. Separate and amplify cDNA at 95°C for 1 min; 10 cycles of 95°C for 30s; 72°C for 1 min; and 72°C for 5 min. Each 10-cycle PCR reaction is expected to produce 1-1.5 µg cDNA. Scale the number of individual reactions as needed to produce the desired total amount of amplified cDNA.
 |
 |
IV. EXAMPLES
As an example of the balanced PCR to retain the difference among alleles between two cDNA populations, microarray studies of human prostate (representing the "target") and lung-derived cDNA (representing the "control") were employed. Digested cDNA was ligated to linkers and screened directly on the Affymetrix Genechip cancer microarrays following the procedure described earlier (Zhang et at., 2001). Next, prostate and lung cDNA samples were mixed 1:1 and amplified via balanced PCR for three consecutive PCR rounds of 20 cycles each. The samples were then separated using the procedure of Fig. 1 and screened on microarrays. The ratio of signal intensities after balanced PCR was plotted versus the same ratio prior to balanced PCR (Fig. 2A). The ratio of expression levels for the majority of genes remained relatively unchanged after balanced PCR, as indicated by the distribution of data in Fig. 2A (R2 = 0.92). Next the experiment was repeated the "traditional" way, i.e., by PCR amplifying separately the prostate and lung cDNA samples and screening each on microarrays (Fig. 2B). Data indicate that, for a substantial fraction of genes, the ratio of expression levels is substantially different from the original one, presumably due to PCRintroduced changes in the original relative expression levels among prostate and lung (R2 = 0.38).
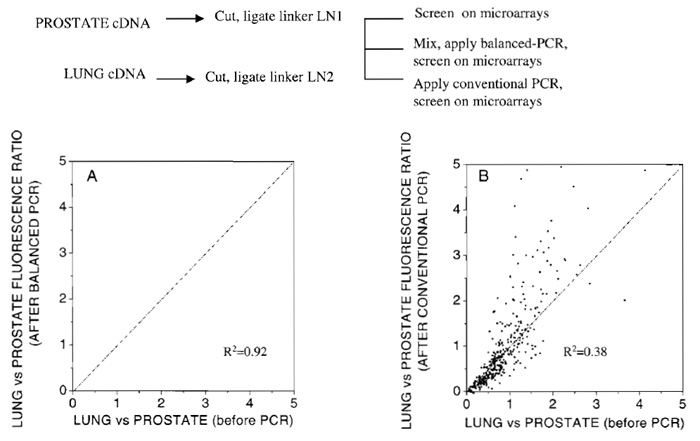 |
| FIGURE 2 Comparison of relative expression of lung vs prostate tissue on microarrays before and after PCR amplification. (A) Amplification conducted using the current balanced PCR method. (B) Amplification conducted by performing conventional PCR, separately on lung and prostate cDNA samples. |
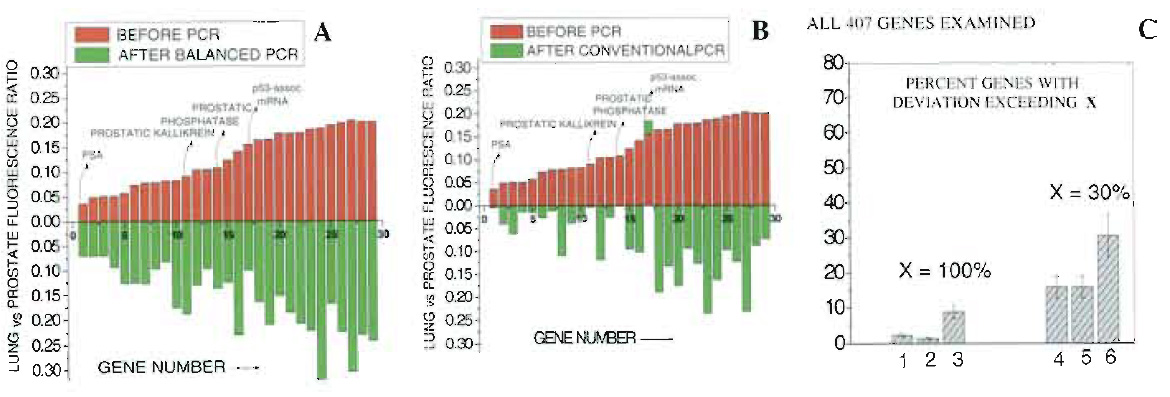 |
| FIGURE 3 Comparison of relative expression of lung vs prostate specifically for the 30 genes highest upregulated in prostate vs lung. (A) Amplification conducted using the current balanced PCR method. (B) Amplification conducted by performing conventional PCR, separately on lung and prostate cDNA samples. (C) Fraction of genes whose relative expression among prostate and lung changes by more than 100% (columns 1-3) or 30% (columns 4-6) following PCR amplification. Columns 1 and 4, repeated application of the same sample on microarrays. Columns 2 and 5, amplification via balanced PCR. Columns 3 and 6, amplification via conventional PCR. Reproduced with permission from Nature Publishing Group. |
A. Efficiency of Enzymatic Treatments
A requirement for the success of balanced PCR is that treatment of target and control DNA is identical at all stages prior to mixing the samples. We conducted control studies and we included internal standards for digestion using Sau3A and ligation to derive the efficiency of digestion and ligation steps (Makrigiorgos et at., 2002). Both were found to be more than 95% efficient. However, if the enzymatic efficiency is reduced due to degradation of the enzyme stocks, impurities, or methylation sensitivity, bias may be introduced in the first step of the procedure. This can be avoided by using freshly obtained enzymes that are highly efficient and that are not sensitive to mammalian CpG methylation.
B. Post.PCR Separation
Another assumption is that the low cycle PCR used for reseparation of the two genomes following the common PCR step does not produce distortions among DNA samples. It is, in principle, possible that this PCR might itself produce some bias among alleles in the two populations. In practice, however, we have found that this 10 cycle separation PCR does not introduce significant distortion among alleles differing by at least 50-fold in initial concentration in any of the systems examined [plasmid, genomic DNA, cDNA (Makrigiorgos et at., 2002)]. However, it is not recommended to increase the separation PCR cycles to beyond 10.
Balanced PCR uses templates from enzymedigested fragments. If mutations occur within the restriction sequences in the target or control cDNAs, then the enzyme will not digest at that position, but will act in the next available restriction sequence. As a result, certain gene fragments in the target genome will be different in size from their alleles in the control genome and PCR amplification may introduce bias if the fragment sizes are too different. Mutations that occur specifically at the restriction sites are not frequent. The most common form of mutations is single nucleotide polymorphisms (SNPs), which, between two given genomes, occur with a frequency of about 1:1000 bases. The chance that a four-base cutter enzyme used in balanced PCR encounters a SNP is roughly 4/1000 = 0.4%, and therefore it would affect only a small fraction of the sequences amplified. Because several SNPs are already tabulated in databases and more will become known in the near future, one can use computational methods to predict which restriction sites will be altered due to a SNP in order to anticipate potential PCR bias at these positions. If these sequences are vital, one may perform balanced PCR using a different restriction enzyme.
Acknowledgment
Funding for this work was provided in part by DOD Grant BC020504.
References
Albertson, D. G., Ylstra, B., Segraves, R., Collins, C., Dairkee, S. H., Kowbel, D., Kuo, W. L., Gray, J. W., and Pinkel, D. (2000). Quantitative mapping of amplicon structure by array CGH identifies CYP24 as a candidate oncogene. Nature Genet. 25, 144-146.
Alizadeh, A. A., Ross, D. T., Perou, C. M., and van de Rijn, M. (2001). Towards a novel classification of human malignancies based on gene expression patterns. J. Pathol. 195, 41-52.
Burki, N. G., Caduff, R., Walt, H., Moll, C., Pejovic, T., Haller, U., and Ward, D. C. (2000). Comparative genomic hybridization of fine needle aspirates from breast carcinomas. Int. J. Cancer 88, 607-613.
Celi, F. S., Cohen, M. M., Antonarakis, S. E., Wertheimer, E., Roth, J., and Shuldiner, A. R. (1994). Determination of gene dosage by a quantitative adaptation of the polymerase chain reaction (gd- PCR): Rapid detection of deletions and duplications of gene sequences. Genomics 21, 304-310.
Dean, F. B., Hosono, S., Fang, L., Wu, X., Faruqi, A. F., Bray-Ward, P., Sun, Z., Zong, Q., Du, Y., Du, J. Driscoll, M., Song, W., Kingsmore, S. F., Egholm, M., and Lasken, R. S. (2002). Comprehensive human genome amplification using multiple displacement amplification. Proc. Natl. Acad. Sci. USA 99, 5261-5266.
Emmert-Buck, M. R., Bonner, R. F., Smith, P. D., Chuaqui, R. F., Zhuang, Z., Goldstein, S. R., Weiss, R. A., and Liotta, L. A. (1996). Laser capture microdissection. Science 274, 998-1001.
Heid, C., Stevens, J., Livak, K., and Williams, P. (1996). Real time quantitative PCR. In "Genome Methods: Genome Research." Cold Spring Harbor Laboratory Press, Cold Spring Harbor, NY.
Kallioniemi, A., Kallioniemi, O. P., Piper, J., Tanner, M., Stokke, T., Chen, L., Smith, H. S., Pinkel, D., Gray, J. W., and Waldman, F. M., (1994). Detection and mapping of amplified DNA sequences in breast cancer by comparative genomic hybridization. Proc. Natl. Acad. Sci. USA 91, 2156-2160.
Klein, C. A., Schmidt-Kittler, O., Schardt, J. A., Pantel, K., Speicher, M. R., and Riethmuller, G. (1999). Comparative genomic hybridization, loss of heterozygosity, and DNA sequence analysis of single cells. Proc. Natl. Acad. Sci. USA 96, 4494-4499.
Lage, J. M., Leamon, J. H., Pejovic, T., Hamann, S., Lacey, M., Dillon, D., Segraves, R., Vossbrinck, B., Gonzalez, A., Pinkel, D., Albertson, D. G., Costa, J., and Lizardi, P. M. (2003). Whole genome analysis of genetic alterations in small DNA samples using hyperbranched strand displacement amplification and array-CGH. Genome Res. 13, 294-307.
Lucito, R., Nakimura, M., West, J. A., Han, Y., Chin, K., Jensen, K., McCombie, R., Gray, J. W., and Wigler, M. (1998). Genetic analysis using genomic representations. Proc. Natl. Acad. Sci. USA 95, 4487-4492.
Makrigiorgos, G. M., Chakrabarti, S., Zhang, Y., Kaur, M., and Price, B. D. (2002). A PCR-based amplification method retaining the quantitative difference between two complex genomes. Nature Biotechnol. 20, 936-939.
Nelson, D. L., Ledbetter, S. A., Corbo, L., Victoria, M. F., Ramirez- Solis, R., Webster, T. D., Ledbetter, D. H., and Caskey, C. T. (1989). Alu polymerase chain reaction: A method for rapid isolation of human-specific sequences from complex DNA sources. Proc. Natl. Acad. Sci. USA 86, 6686-6690.
Pinkel, D., Segraves, R., Sudar, D., Clark, S., Poole, I., Kowbel, D., Collins, C., Kuo, W. L., Chen, C., Zhai, Y., Dairkee, S. H., Ljung, B. M., Gray, J. W., and Albertson, D. G. (1998). High resolution analysis of DNA copy number variation using comparative genomic hybridization to microarrays. Nature Genet. 20, 207-211.
Pollack, J. R., Perou, C. M., Alizadeh, A. A., Eisen, M. B., Pergamenschikov, A., Williams, C. F., Jeffrey, S. S., Botstein, D., and Brown, P. O. (1999). Genome-wide analysis of DNA copy-number changes using cDNA microarrays. Nature Genet. 23, 41-46.
Ross, D. T., and Perou, C. M. (2001). A comparison of gene expression signatures from breast tumors and breast tissue derived cell lines. Dis. Mark. 17, 99-109.
Rubin, M. A. (2002). Understanding disease cell by cell. Science 296, 1329-1330.
Scheurle, D., DeYoung, M. P., Binninger, D. M., Page, H., Jahanzeb, M., and Narayanan, R. (2000). Cancer gene discovery using digital differential display. Cancer Res. 60, 4037-4043.
Telenius, H., Carter, N. P., Bebb, C. E., Nordenskjold, M., Ponder, B. A., and Tunnacliffe, A. (1992). Degenerate oligonucleotideprimed PCR: General amplification of target DNA by a single degenerate primer. Genomics 13, 718-725.
van 't Veer, L. J., Dai, H., van de Vijver, M. J., He, Y. D., Hart, A. A., Mao, M., Peterse, H. L., van der Kooy, K., Marton, M. J., Witteveen, A. T., Schreiber, G. J., Kerkhoven, R. M., Roberts, C., Linsley, P. S., Bernards, R., and Friend, S. H. (2002). Gene expression profiling predicts clinical outcome of breast cancer. Nature 415, 530-536.
Wang, G., Brennan, C., Rook, M., Wolfe, J., Leo, C., Chin, L., Pan, H., Liu, W., Price, B., and Makrigiorgos, G. M. (2004). Balanced-PCR amplification allows unbiased identification of genomic copy changes in minute cell and tissue samples. Nucleic Acids Research, 32, e76.
Zhang, L., Cui, X., Schmitt, K., Hubert, R., Navidi, W., and Arnheim, N. (1992). Whole genome amplification from a single cell: Implications for genetic analysis. Proc. Natl. Acad. Sci. USA 89, 5847-5851.
Zhang, Y., Price, B. D., Tetradis, S., Chakrabarti, S., Maulik, G., and Makrigiorgos, G. M. (2001). Reproducible and inexpensive probe preparation for oligonucleotide arrays. Nucleic Acids Res. 29, E66-E66.
Support our developers


