Single Nucleotide Polymorphism Analysis by Matrix-Assisted Laser Desorption/Ionization Time-of-F'light Mass Spectrometry
Modern humans as a species have a limited amount of genetic variation, most of which is attributable to common allelic variants. Any two haploid copies of the human genome differ at one site per kilobase on average (Sachidanandam et al., 2001). Single nucleotide polymorphisms (SNPs) are the most abundant form of sequence variation, accounting for nearly 90% of all sequence variants in the human population. The remaining 10% consists of large and small insertions and deletions (indels). Simulation studies have estimated that there are between 10 and 15 million common (minor allele frequency greater or equal to 1%) SNPs in the human population (Kruglyak and Nickerson, 2001).
The identification and cataloguing of these common variants have been the objectives of the Human Genome Project (HGP; IHGSC, 2001). Systematic SNP discovery and mapping became feasible in the first instance with the availability of a draft sequence of the human genome (IHGSC, 2001). As a result, the International SNP Mapping Consortium reported a map of 1.42 million SNPs in 2001 (Sachidanandam et al., 2001). With a finished reference sequence of the human genome now in hand (IHGSC, 2004), every identified variant can be mapped to a genomic location and correlated with genes and other functionally important sequences such as regulatory elements. Note that not all human sequence variants will have a unique map position in the genome due to the abundance of repeat elements such as LINEs and SINEs and extensive inter- and intrachromosomal segmental duplications (IHGSC, 2004). The presence of paralogous sequences, which are functionally important (e.g., gene families), throughout the genome further contributes to the complexity. Since 2001, systematic SNP discovery through both targeted and random genome-wide efforts has yielded over 7.2 million SNPs, which have unique map positions in the reference sequence and are available publicly (dbSNP; build 120). In addition to the publicly available SNP resources, a number of commercial entities have undertaken large-scale SNP discovery projects, most notably Celera and Perlgen.
Matrix-Assisted Laser Desorption/lonisation Time-of-Flight Mass Spectrometry
Analysis of nucleic acids (>10 nucleotides long) by mass spectrometry became feasible with the introduction of ionization techniques, such as electrospray ionization (ESI) and matrix-assisted laser desorption / ionisation (Karas and Hillenkamp, 1988). Two key factors in terms of resolution and signal-to-noise ratio in the obtained mass spectra are sample preparation and the type of compound used to embed the sample, typically a small organic molecule that can crystalise (matrix). Introduction of the dried-droplet method for sample preparation (Nordhoff et al., 1992) and automated MALDI measurement (reviewed in Little et al., 1997) streamlined the use of MALDI-TOF MS in the analysis of DNA molecules. The principle of MALDI-TOF MS is shown in Fig. 1 (for a review, see Jurinke et al., 2004).
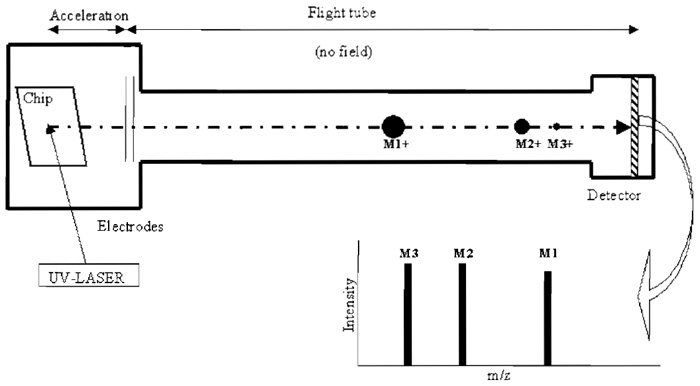 |
| FIGURE 1 MALDI-TOF MS (modified from Pusch et at., 2001). Each spot on the chip consists of a matrix (e.g., 3-hydroxypicolinic acid) recrystallised in the presence of analyte. Firing UV laser pulses to a spot causes desorption and ionisation of matrix and analyte ions, which are accelerated prior to entering the flight tube by applying a potential. The time of flight of each ion is measured and converted into m/z (mass to charge ratio). The separation and detection of three positively, single-charged ions with different masses (M1, M2, and M3) are shown. |
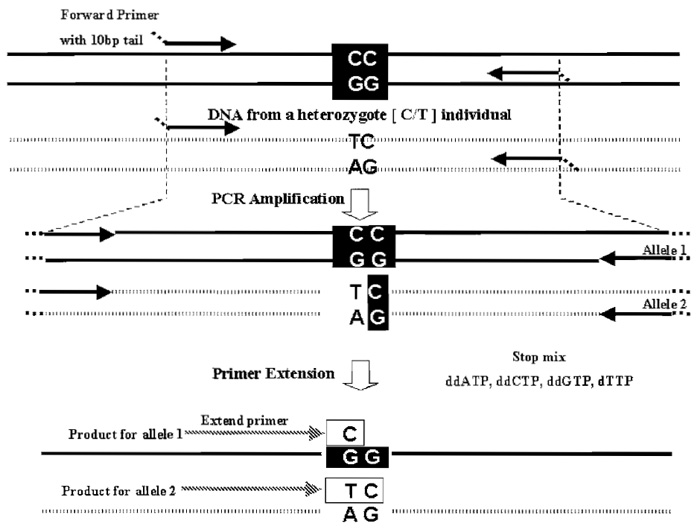 |
| FIGURE 2 The PROBE assay for one SNP is shown. The assay works optimally with small amplicons 80-100 bp (specially in multiplex mode). Synthesizing the PCR primers with a universal 10-bp tail (not present in human DNA) increases their mass so that unused PCR primers do not interfere with product analysis. Post-PCR the unincorporated dNTPs are removed with shrimp alkaline phosphatase (not shown). Typically, the 3' end of the extend primer is the base preceding the SNP. Multiplexing is achieved by varying the size of the extend primer used in each SNP assay, but the assays need to be compatible with the use of a single stop mix. In an optimal multiplex assay design, masses of all extend primers and possible extension products are chosen so that they differ by at least 30 Da from each other. |
The MassArray system is from Sequenom, Inc. and is composed of a MassArray nanodispenser, a Brucker Biflex mass spectrometer, and a MultiMek. The system includes an ORACLE database and a suite of software tools for assay design (Spectrodesigner v.1.3.4) and real-time automated genotype calling (SpectroTyper v.2.0). Spectra acquisition occurs via the Brucker software installed on the mass spectrometer. The Roto- Shake Genie, 120 V, 60 Hz 0.5 amps is from Scientific Industries, Inc. (Cat. No. SI-1100). Thermocyclers, PTC-225 DNA Engine Tetrad with 384-well Alpha unit blocks, and Microseal "A" film (Cat. No. MSA-5001) are from MJ Research, Inc. The spectrofluorometer, the Cytofluor 4000 multiwell plate reader (any standard spectrofluorometer will work), optically clear microtitre plates (96-well cytoplate, Cat. No. CFCPN9610), and 10x polymerase chain reaction (PCR) buffer [10 mM Tris-HCl, 500 mM KCl, 15 mM MgCl2, 0.01% (w/v) gelatine; Cat. No. N808-0189] are from Applied Biosystems. Multichannel electronic pipettors (Matrix Impact, 0.5-12.5 µl; Cat. No. 2009) are from Matrix. PCR primers (standard desalted oligonucleotides) and extend primers (reverse phase purified) are from Sigma-Genosys. The SpectroCLEAN kit (dimple 384-well plate; Cat. No. 11220), SpectroCHIP (384-well; Cat. No. 00601), SpectroCLEAN Resin (Cat. No. 10053), and 3-Oligo Calibrant mix (Cat. No. 00335) are from Sequenom, Inc. The PicoGreen dsDNA quantitation kit (Cat. No. P-7589) is from Molecular Probes. Titanium Taq polymerase (Cat. No. 8434-2) is from BD BiosciencesmClontech. Shrimp alkaline phosphatase 1 U/µl (Cat. No. 70092X), Thermosequanase DNA polymerase 32U/µl (Cat. No. E 79000Z), ddNTPs (Cat. Nos. ddATP:27-2051, ddCTP:27-2061, ddGTP:27-2071, and ddTTP:27-2081), and dNTPs 100mM (set of four: 27-2035-01) are from Amersham Biosciences (USB). Hotstart Taq DNA polymerase (Cat. No. 203203) is from Qiagen. THERMIPol DNA polymerase is from Solis Biodyne, Estonia. (no Cat No.). PCR 384-well microtitre plates (Thermo-Fast; Cat. No. TF-0384) are from ABgene. Source plates are from Bibby Sterilin (microtitre plates, 96-well V bottom, sterile; Cat. No. 612V96). HPLC grade H2O (Cat. No. 152736D) and standard chemicals are from BDH.
- TE buffer: 10mM Tris-HCl, 1 mM EDTA, pH75
- dNTP mix: 5 mM each dNTP in H2O
- DNA: 1.75ng/µl in T0.1E
- 10x Thermosequenase buffer: 260mM Tris-HCl, pH 9.5, 65 mM MgCl2
- Stop mix: 500µM each appropriate ddNTP or dNTP in H2O
- Extend primer mix: 10µM each primer in H2O
III. PROCEDURES
A. DNA Quantitation with PicoGreen
Accurate measurement of DNA concentration is not an important issue when genotyping individual samples by the homogeneous MassExtend protocol. In contrast, allele frequency estimation in pooled samples is completely dependent on the accurate measurement of DNA concentration in the samples used to form the pool. The following protocol is adapted from the PicoGreen dsDNA quantitation kit.
- Dilute λ DNA standard solution to 5ng/µl with TE buffer. In an optically clear microtitre plate, prepare the following dilutions of phage λ DNA in duplicate:
1× TE DNA Standard (µl) Well 1 80 20 84 16 88 12 92 8 96 4 98 2 99 1 Well 8 100 0
- Dilute each DNA sample to be measured with TE buffer to approximately 8ng/µl (20µl total) in duplicate. Aliquot 5 µl of each sample into two wells of the microtitre plate and add 95 µl of TE to each well (giving four wells per DNA in total).
- Add 100µl of 1× PicoGreen (kit solution diluted to 1× with TE) to each well with a multichannel pipette. Mix by spinning down plate at 4000rpm (swing-out rotor) for 1 s. Note that this step needs to be executed as fast as possible.
- Incubate plate in the dark (e.g., cover with aluminium foil) for 4min.
- Measure fluorescence in a standard spectrofluorometer: excitation: 480nm and emission: 520nm.
- Subtract the fluorescence value of the blank from that of each sample. Use the λ dilutions (average value) to draw a standard curve of fluorescence versus DNA concentration.
- Determine the DNA concentration of the samples from the standard curve. Compare duplicates for reproducibility.
B. SNP Genotyping with the Homogeneous MassExtend Protocol
The following protocol is a modification of the recommended protocol supplied by Sequenom, Inc. for use with the MassArray system. The experimental layout is based on a manual setup for typing 48 SNPs in four-plex reactions across a panel of 96 samples (95 DNAs and a negative control). The described setup includes dead volumes, whereas the volumes per single reaction are given in parentheses. Note that the procedure is amenable to many different formats in terms of SNPs vs samples vs level of multiplexing. For example, assaying the same multiplex across 384 samples will require a single mix (see step 1) and adjustment of volumes accordingly. In addition, a number of standard robotic devices for liquid handling can be used to automate steps of the procedures.
dbSNP is the main repository of publicly available SNP data and is maintained at the National Institute for Biotechnology Information (NCBI; http://www.ncbi.nlm.nih.gov/SNP) in the United States. dbSNP has three identifiers per SNP, namely the submitter SNP ID, the NCBI assay ID(ss) and the reference SNP ID(rs). Note that the same SNP can have more than one "ss" identifiers and hence it is recommended to always use the "rs" identifiers, which are unique. Typically, dbSNP will use the most recent and verified human genome sequence assembly, referred to as Golden Path or NCBI build, to obtain genome locations of all submitted SNPs. As the assembly of the human genome sequence is still evolving, it is possible that previously accessioned reference SNPs are either dropped (e.g., map to multiple locations) or two reference SNPs are merged to a new one with a different rs identifier. Although previous identifiers can be tracked, this remains an informatics challenge and should be monitored carefully in large-scale projects. Additional query tools such as dbSNP's "Entrez SNP" and the "EnsMart" of the Ensembl genome browser (http://www.ensembl.org/EnsMart/) allow the retrieval of SNPs with specified characteristics (e.g., experimentally verified, allele frequency cut off, coding, nonsynonymous, etc.) within a defined chromosomal region or gene. An additional source of validated SNP assays, allele frequencies, and, in the near future, common haplotypes and htSNPs is the international HapMap project (http://www.hapmap.org; International HapMap Consortium, 2003). Once SNPs have been selected and extracted from the database with 400bp (minimum 120bp) of flanking sequence either side of the SNP, it is recommended to perform a redundancy check with BLASTN. This is critical when dealing with large numbers of SNPs. Then, the sequences need to be parsed through a repeat masking programme such as RepeatMasker (http:// repeatmasker.genome.washington.edu). Tag repeat sequences in lowercase to generate input SNP sequences for the SpectroDesigner vl.3.4 software. In general, the higher the number of SNP sequences in the input file, the higher the ability of SpectroDesigner to multiplex them successfully. For example, for 1000 of more SNPs and a four-plex level of multiplexing over 96% of SNPs get assays designed for. Optimal amplicon length is 80-100bp but this is less critical when designing single-plex reactions. It is recommended to add a universal 10-bp tag to the PCR primers; this generates primers with masses outside the active window for analysis of the extended products (5-9 kDa). Note that newer versions of SpctroDesigner, e.g., v.2.0, support higher multiplexing, replexing of successful assays from different multiplexes, and assay design for triallelic SNPs and indels.
3. PCR Amplification of SNP loci (Four-plex Reactions)
- Aliquot 2µl of DNA (1.75ng/µl) into each well of a 384-well PCR plate. For a panel of 96 samples, DNA1 is present in wells A1, A2, B1, and B2, DNA2 in wells A3, A4, B3, and B4, etc. To type 48 SNPs in four-plex reactions, prepare three plates. Centrifuge plates at 1000rpm for 1 min. Prepare the following PCR mix:
1395.0µl 10x PCR buffer (0.75 µl per reaction)
372.0µl dNTP mix (0.2 µl per reaction)
18.6 µl H2O (0.01µl per reaction)
74.4 µl titanium Taq polymerase (0.04 µl per reaction)
1860.0µl (1 µl per reaction)
Mix well and aliquot into 12 tubes (150µl per tube). Label each tube according to a SNP multiplex and add 300µl of the corresponding PCR primer mix (375 nM each primer; 2 µl per reaction). Use two 96-well source plates to aliquot the content of each tube (34µl per well) across a plate row (i.e., tube 1 across A1-A12, tube 2 across B1-B12..., tube 8 across H1-H12, tube 9 across A1'-A12', etc.; make a note of the exact order as it is needed in step 5). - We recommend placing a plastic template sheet colour coded according to the transfer pattern under the source and the PCR plate. Use a 12-channel pipette to transfer from the source to the PCR plates as follows: rows A-D and E-H of the first source plate and rows A'-D' of the second source plate will feed PCR plate 1, 2, and 3, respectively. Row A of the first source plate will feed positions 1, 3, 5, 7... 23 in rows A, C, E, G, I, K, M, and O of PCR plate 1. Transfer 3 µl to each well (gently tap down plates and inspect that wells are filled uniformly). Seal plates with microseal mats (use a roller to ensure good and uniform adhesion of the mat across the plate). Centrifuge plates at 1000rpm for 1 min and place them on thermocyclers (for MJ Tetrads the programme parameters we use are: volume (µl) = 5 and heated lids: YES). Run PCR under the following conditions: 45 cycles each consisting of 20s at 95°C, 30s at 56°C, and lmin at 72°C followed by one cycle for 3min at 72°C followed by an indefinite cycle at 15°C (to prevent evaporation for overnight runs). Remove plates and spin down at 1000rpm for lmin.
- Prepare the following mix:
271.0pl 10x Thermosequenase buffer (0.2pl per reaction)
2032.5 pl H2O (1.5 µl per reaction)
406.5µl shrimp alkaline phosphatase (0.3µl per reaction)
2710.0 pl (2 pl per reaction)
Aliquot 220 pl across a row of a 96-well plate. With a 12-channel pipette add 2pl in each well of the reaction plates from step 2. - Seal each plate with a microseal mat and then centrifuge plates at 1000rpm for 1 min. Incubate plates on a thermocycler under the following conditions: 20min at 37°C followed by 5 min at 80°C followed by an indefinite cycle at 15°C. At this stage you can either seal and store plates at -20°C or proceed to the next step.
5. Oligobase Extention
- Prepare the following mix:
479.0pl 10x Thermosequenase buffer (0.2pl per reaction)
914.9pl H2O (0.382pl per reaction)
43.1 µl Thermosequenase (0.018pl per reaction)
1437.0 µl (0.6 lal per reaction)
Label 12 tubes as in step 1 with the corresponding extend primer mix. Aliquot 114µl of the aforementioned mix to each tube. To each tube add 95 and 171 µl of the appropriate extend primer mix (0.5pl per reaction) and stop mix (0.9pl per reaction), respectively. In the same order as in step 1 (i.e., match PCR to extend reactions), aliquot the content of each tube (26 pl per well) across a row of a 96-well source plate, referred to as extend source plates. - Aliquot the contents of the extend source plates into the reaction plates (from step 4) as described in step 2. Transfer 2pl per well. Seal each plate with a microseal mat and then centrifuge plates at 1000rpm for 1 min. Cycle plates under the following conditions: one cycle at 94°C for 2min followed by 55 cycles each consisting of 5 s at 94°C, 5s at 52°C, and 5s at 72°C followed by an indefinite cycle at 15°C (to prevent evaporation for overnight runs). At this stage you can either seal and store plates at -20°C or proceed to the next step.
- Add 16 µl of HPLC grade H2O to each well of the reaction plates from step 6.
- Use a spoon to apply resin onto a 384-well dimpled plate. Force the resin into the grooves of the dimpled plate using the spoon and the plastic scraper. Scrape off any excess resin and let the dimpled plate stand for 10-15min at room temperature (resin becomes more compact as it dries out; timing will vary with each resin batch and needs testing).
- Invert each 384-well reaction plate over a dimpled plate containing resin (allow time between plates if working alone). Align the wells of the two plates (it is easier to hold the two plates above eye level). Hold plates firmly and invert, ensuring no slippage. At this stage the resin should drop into the wells of the reaction platemif you observe incomplete transfer, then tap the back of the dimple plate gently with a spoon.
- Seal plates with "3M scotch pad" adhesive sheets and put them in a plastic bag. Attach bag on the rotator using Velcro. Rotate for 10min (typically, we set the rotator speed to 8).
- Centrifuge plates for 4min at 4000rpm (maximum speed for centrifuge). At this stage samples are ready for spotting onto spectrochips.
- Spin the reaction plates from step 11 for 5 min at 4000rpm.
- Place plates into the holders of the SpectroPoint (spotting device) and an equal number of spectrochips on the black metal chip holder referred to as SCOUT plate (the Biflex mass spectrometer uses a SCOUT ion source). The spotting device should be operated according to the manufacturer's instructions. In brief, select the chip positions for the run in the "SCOUT plate" window. Click on the "Run" menu and enter the following settings:
Run type: Partial run
Spotting: Wet run
Transfer type: 384 to 384
Select "Main Spots"
Then click on the "Clean" menu and set "Clean cycles" to 1. Start the run. At the end of the run, add 3-oligo calibrant mix to each chip. - With tweezers, transfer the chips from the black SCOUT plate to the silver SCOUT plate by matching positions. We use a Biflex mass spectrometer, which runs both the original Bruker software and Sequenom's SpectroTyper v.2.0 software (a switch box allows to change from one to the other). Note that newer instruments and software are available; follow the instructions provided by the manufacturer. In brief, select the Bruker software, open the mass spectrometer, and insert the loaded SCOUT plate. In the "Automatic probe introduction" window, click "Probe in." From the Auto X menu select "Teach Calib Posit" and look in the monitor if positions (A1 and P24 of chip 1) need adjusting. Switch to the SpectroTyper v.2.0 software, select the Plate Editor, and link the appropriate assay template(s) to the corresponding chip(s). Enter chip(s) into the queue (SpectroAcquire) and initiate the run.
8. Data Analysis
As spectra get acquired, genotype calling occurs in real time so that results are instantly available. Each call has an accompanying tag, namely conservative, moderate, aggressive, or bad spectra, which provides a measure of confidence of the underlying data (pick height, signal-to-noise ratio, etc.). Both conservative and moderate calls are of high quality, whereas aggressive calls may contain errors. Although it strongly depends on the marker assayed, there is a 2- to 10-fold increase in error rate in aggressive calls. Markers with more than 1-2% of aggressive calls are not robust. As a rule of thumb, data from SNPs with an overall call rate <70% should be excluded from further analysis. Robust assays yield a call rate of at least 80%. The software provides several tools to zoom into spectra and alter manually genotype calls.
One of the major issues relating to genotyping methods is the cost per genotype. Thermosequenase, which is used in the primer extension step in the aforementioned protocol, accounts for 20% of reagent costs per sample. We evaluated the THERMIPol DNA polymerase, which is 80-fold less expensive, as a one-toone substitute for Thermosequenase (same buffer and cycling conditions). We found excellent concordance between the two enzymes, although we noted a slight drop in the average call rate: <1% with THERMIPol DNA polymerase.
For allele frequency estimation in pooled DNA samples (Ross et al., 2000; for review, see Jurinke et al.), we use the aforementioned protocol with the following modifications: PCR reactions contain 25ng of DNA, 200nM of each forward and reverse primer, and 0.04U of HotStar Taq polymerase. Four aliquots per reaction are spotted on the Spectrochip. The laser of mass spectrometer is set to fire at five different areas of each matrix pad. Analysis requires MassARRAY quantitative gene analysis software. We conducted a statistical evaluation of the optimal design for association studies based on pooled DNA samples using this protocol (Downes et al., 2004).
- A problem encountered by all SNP typing methodologies that employ PCR amplification of the locus surrounding the variant to be assayed is allelic dropout. Typically, when screening nonvalidated SNPs we find that 2-3% of markers suffer from this problem. Appropriate controls during assay development, such as duplicate samples or DNAs from related individuals (families, trios), as well as analysis tests such as Hardy-Weinberg, should be applied to weed out nonrobust assays. Be cautious when calling a SNP monomorphic!
- Although SpectroDesigner checks primers for self-complementarity, empirical data show that selfpriming does occur, although with low frequency. Clearly, in the presence of a DNA template this type of reaction is suppressed. However, it is almost impossible without laborious side controls to know whether PCR amplification of a sample has occurred successfully for all the markers in a multiplex reaction. Typically, we test new assays against two positive and two negative controls prior to assaying a larger set of samples. In our experience, markers that trigger a reaction in both negative controls should be excluded (or redesign the assay).
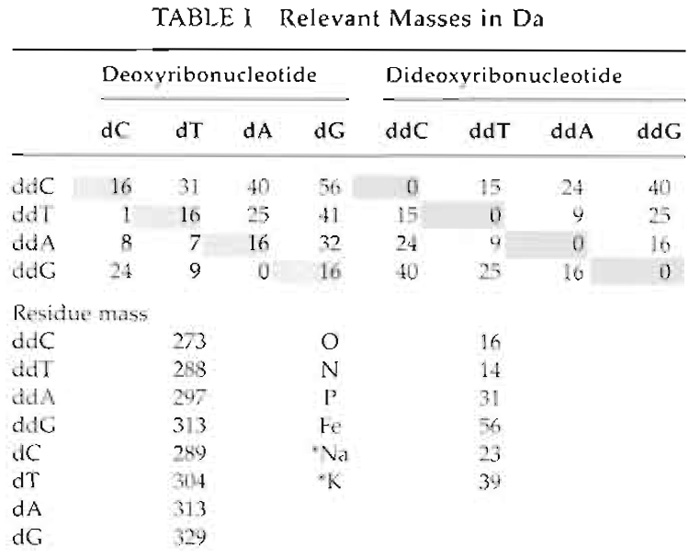
- DNA molecules are negatively charged due to their phosphate backbone, which in the presence of cations leads to adduct formation. For example, a sodium ion attached to an extended product will increase its mass by 23 Da (Table I). Typically, this will cause a split signal at the expected and the +23 Da mass positions. Adduct formation can lead to erroneous calling, especially at higher levels of multiplexing. Ensure that the desalting step is working, i.e., adjust rotation speed or increase incubation time.
 |
References
Braun, A., Little, D. P., and K6ster, H. (1997). Detecting CFTR gene mutations by using primer oligo base extension and mass spectrometry. Clin. Chem. 43, 1151-1158.
Downes, K., Barratt, B. J., Akan, P., Bumpstead, S. J., Taylor, S. D., Clayton, D. G., and Deloukas, P. (2004). SNP allele frequency estimation in DNA pools and variance components analysis. Biotechniques, 36, 840-845.
Jeffreys, A. J., Kauppi, L., and Neumann, R. (2001). Intensely punctate meiotic recombination in the class II region of the major histocompatibility complex. Nature Genet. 29, 217-222.
Johnson, G. C., Esposito, L., Barratt, B. J., Smith, A. N., Heward, J., Di Genova, G., Ueda, H., Cordell, H. J., Eaves, I. A., Dudbridge, F., Twells, R. C., Payne, F., Hughes, W., Nutland, S., Stevens, H., Carr, P., Tuomilehto-Wolf, E., Tuomilehto, J., Gough, S. C., Clayton, D. G., and Todd J. A. (2001). Haplotype tagging for the identification of common disease genes. Nature Genet. 29, 233-237.
Jurinke, C., Oeth, P., and van den Boom, D. (2004). MALDI-TOF mass spectrometry: A versatile tool for high-performance DNA analysis. Mol. Biotechnol. 26, 147-164.
Karas, M., and Hillenkamp, F. (1988). Laser desorption ionization of proteins with molecular masses exceeding 10,000 daltons. Anal. Chem. 60, 2299-2301.
Ke, X., Hunt, S., Tapper, W., Lawrence, R., Stavrides, G., Ghori, J., Whittaker, P., Collins, A., Morris, A. P., Bentley, D., Cardon, L. R., and Deloukas, P. (2004). The impact of SNP density on finescale patterns of linkage disequilibrium. Hum. Mot. Genet. 13, 577-588.
Kruglyak, L., and Nickerson, D. A. (2001). Variation is the spice of life. Nature Genet. 27, 234-236.
Kwok, P.-Y. (2001). Methods for genotyping single nucleotide polymorphisms. Annu. Rev. Genomics Hum. Genet. 2, 235-258.
Lechner, D., Lathrop, M. G., and Gut, I. G. (2001). Large-scale genotyping by mass spectrometry: Experience, advances and obstacles. Curr. Opin. Chem. Biol. 6, 31-38.
Little, D. P., Braun, A., O'Donnell, M. J., and Koster, H. (1997). Mass spectrometry from miniaturized arrays for full comparative DNA analysis. Nature Med. 3, 1413-1416.
Mir, K. U., and Southern, E. M. (2000). Sequence variation in genes and genomic DNA: Methods for large-scale analysis. Annu. Rev. Genomics Hum. Genet. 1, 329-360.
Nordhoff, E., Ingendoh, A., Cramer, R., Overberg, A., Stahl, B., Karas, M., Hillenkamp, F., and Crain, P. F. (1992). Matrix-assisted laser desorption/ionization mass spectrometry of nucleic acids with wavelengths in the ultraviolet and infrared. Rapid Commun. Mass Spectrom. 6, 771-776.
Pusch, W., Wurmbach, J. H., Thiele, H., and Kostrzewa, M. (2002). MALDI-TOF mass spectrometry-based genotyping. Pharmacogenomics 3, 537-548.
Ross, P., Hall, L., and Haft L. A. (2000). Quantitative approach to single-nucleotide polymorphism analysis using MALDI-TOF mass spectrometry. Biotechniques 29, 620-626.
Sachidanandam, R., Weissman, D., Schmidt, S. C., Kakol, J. M., Stein, L. D., Marth, G., Sherry, S., Mullikin, J. C., Mortimore, B. J., Willey, D. L., Hunt, S. E., Cole, C. G., Coggill, P. C., Rice, C. M., Ning, Z., Rogers, J., Bentley, D. R., Kwok, PY., Mardis, E. R., Yeh, R. T., Schultz, B., Cook, L., Davenport, R., Dante, M., Fulton, L., Hillier, L., Waterston, R. H., McPherson, J. D., Gilman, B., Schaffner, S., Van Etten, W. J., Reich, D., Higgins, J., Daly, M. J., Blumenstiel, B., Baldwin, J., Stange-Thomann, N., Zody, M. C., Linton, L., Lander, E. S., and Altshuler, D. (2001). A map of human genome sequence variation containing 1.42 million single nucleotide polymorphisms. Nature 409, 928-933.
Syvänen, A.-C. (2001). Accessing genetic variation: Genotyping single nucleotide polymorphisms. Nature Rev. Genet. 2, 930-942.
The International HapMap Consortium (2003). The International HapMap Project. Nature 426, 7897-7896.
The International Human Genome Sequencing Consortium (2001). Initial sequencing of the human genome. Nature 409, 860-921.
The International Human Genome Sequencing Consortium (2004). Finished sequence of the human genome. Nature, 431, 931-945.
Support our developers


