Concentrations of Nitrogen in Plants
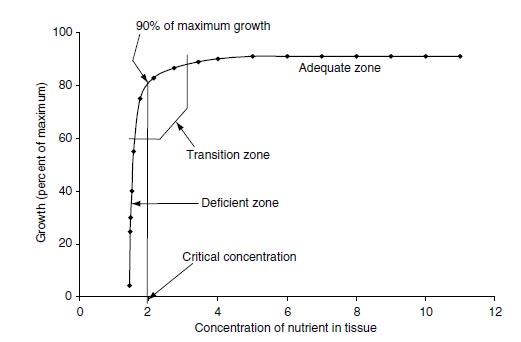
Many attempts have been made to relate yields of crops to nutrient supply in media and to accumulation in plants. Deficiency of nitrogen or another nutrient is associated with suboptimum development of a plant, as reflected by the appearance of symptoms of deficiency, the suppression of yields, or to the response of plants after the accumulation of the deficient nutrient following its application as a fertilizer. Plant analysis (tissue testing) is used in the diagnosis of nutritional deficiency, sufficiency, or excess. Generally, the concentrations of nitrogen in plants reflect the supply of nitrogen in the root medium, and yields increase as internal concentration of nitrogen in plants increases. The use of information on internal concentrations of nitrogen in plants should not be directed toward forecasting of yields as much as it should be used in assessing how yields can be improved by fertilization.Various models have been developed to describe the response of plants to nutrient supply and accumulation (67). Pfeiffer et al. (68) proposed a hyperbolic model in which plants approached an asymptote or maximum value as nutrient accumulation increased. Linear models have been proposed to describe growth responses to nutrient accumulation (67). Other researchers identified a three-phase model (69–71) (Figure 2.2). In this model, growth curves describe a deficient level of nutrient accumulation, region of poverty adjustment, or minimum percentage where yields rise with increasing internal concentrations of nitrogen. In the second zone of the growth curve, a transition from deficiency to sufficiency occurs followed by a region known as luxury consumption in which internal concentration of nitrogen rises but yield does not rise. The concentration of nitrogen at the transition from deficiency to sufficiency is known as the critical concentration. Eventually, nitrogen accumulation will rise to excessive or toxic levels.
 |
| FIGURE 2.2 Model of plant growth response to concentration of nutrients in plant tissue. Units of concentration of nutrient in tissue are arbitrary. The model shows the critical concentration of nutrient at a response that is 90% of the maximum growth obtained by nutrient accumulation in the tissue. Deficient zone, transition zone, and adequate zone indicate concentrations at which nutrients may be lacking, marginal, or sufficient for crop yields. |
Nitrogen concentrations in plants vary with species and with varieties within species (72,73). Nitrogen accumulation in plants also varies among families. Herbaceous crops from fertilized fields commonly have concentrations of nitrogen that exceed 3% of the dry mass of mature leaves. Leaves of grasses (Gramineae, Poaceae) (1.5 to 3.5% N) are typically lower in total nitrogen concentrations than those of legumes (Leguminosae, Fabaceae) (>3% N). Leaves of trees and woody ornamentals may have <1.5% N in mature leaves. Genetic differences attributable to species or families are due to many factors affecting absorption and metabolism of nitrogen and plant growth in general. The concentrations of nitrogen in leaves, stems, and roots changes during the growing season. In the early stages of growth, concentrations will be high throughout the plant. As plants mature the concentrations of nitrogen in these organs fall, and is usually independent of the initial external supply of nitrogen. Mobilization of nitrogen from old leaves to meristems, young leaves, and fruits leads to a diminished concentration of nitrogen in old, bottom leaves of plants. Whether a plant is annual, biennial, or perennial affects considerations of yield relations and the state of nutrient accumulation in organs (leaves) during the season. If the development of a plant is restricted by low levels of external factors, such as other nutrients, water, or temperature, internal concentration of nitrogen may rise. Root structure and metabolism can lead to differential accumulation of nitrogen. Assimilation and transport of nitrogenous compounds in plants can lead to differential accumulation among species and within the plants. Nitrogen sources can have large effects on total nitrogen concentrations in plants. Plants grown on ammonium nutrition can have twice the nitrogen concentrations in vegetative parts as plants grown on nitrate nutrition.
 |
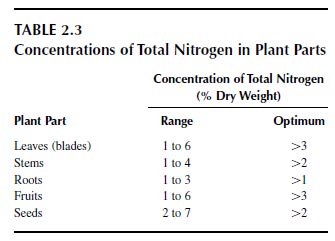
The choice of tissue for plant analysis is important in plant diagnosis (Table 2.3). Generally, leaves are the most satisfactory plant part to use for diagnosis (69,72,74). Blades are used more frequently than leaf petioles or whole leaves. Blades are chosen as the diagnostic part if total nitrogen is to be assessed, whereas petioles may be selected if the nitrogenous component is soluble, such as nitrate. Total nitrogen quantity in tissues is the most commonly measured fraction, although some researchers believe that nitrate contents reflect the nutritional status better than total nitrogen.
Concentrations of Nitrogen in Plant Parts
With a nutrient supply in which all elements except nitrogen are held at a constant high level, the concentration of nitrogen in a plant will be expected to rise, along with growth and yields, with increases in nitrogen supply. Nitrogen concentrations in leaves are often not correlated with increased growth and yields. Shortages of other nutrients or stresses imposed by growth-limiting temperatures or water supply can cause concentrations of total nitrogen or nitrate to increase, along with a suppression of yield (75). The age of plant tissues is important in diagnosis of nitrogen sufficiency. In the early stages of plant growth, the concentration of nitrogen in plants will be higher than at the later stages. Increased external concentrations of nitrogen will increase the concentration of nitrogen in plant organs, but the trend is for nitrogen concentrations to fall in leaves, stems, and roots as plants mature. These changes will vary with whether the plant is annual, biennial, or perennial (67). It is important to sample plants for nitrogen determinations at a given time of the year or stage of plant development. Some researchers recommend that samples be taken at a certain time of the day, since light intensity and duration can affect the amount of nitrate in tissues (76). Nutrient concentrations in leaves can vary by as much as 40% during a diurnal period (67). Nitrate can vary with time of day, with lower concentrations occurring in the afternoon than in the morning.Analysis of whole shoots may be the best index of the nutritional status of plants even though each organ of a plant will vary in nitrogen concentrations. Since organs of plants vary in composition and since the proportions of organs vary with the nitrogen status of plants, a particular organ of a plant is usually chosen for analysis. Conducting tissue, such as that of stems or petioles, may provide the best index of the response of plants to nutrient applications or the best index of the nutrient status at a given time in growth. Nitrate concentrations in corn (Zea mays L.) stalks are usually several times higher than those of leaves (77). Measurement of nitrate in the lower stalk of corn is valuable in the diagnosis of the nitrogen status of the crop (78–80). Brouder et al. (79) noted that analysis of grain for total nitrogen was as good as the stalk test in determining sufficiency or deficiency of corn. Leaf petioles as conducting tissues are often analyzed to assess the nutritional status of vegetable crops (81).
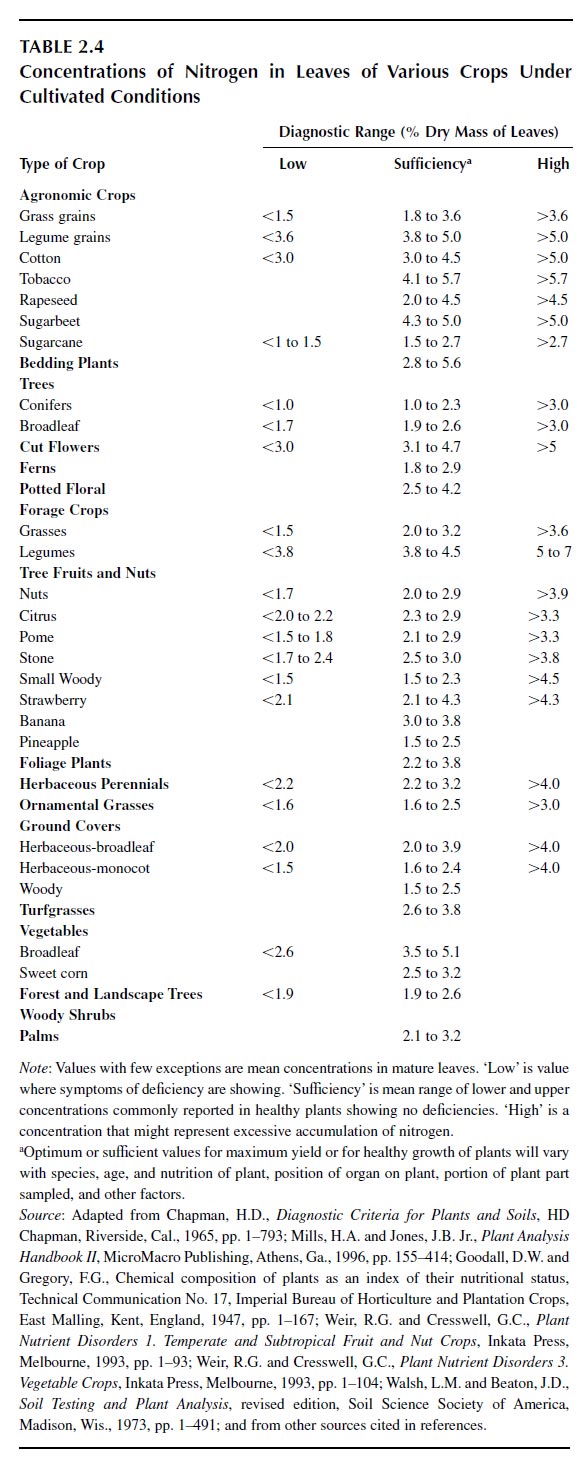
Leaves are often taken as samples for nitrogen determinations since they are the organs of active assimilation and hence likely to be the best for analysis to reflect the nutrient status of the whole plant. Leaf samples can be taken conveniently in nondestructive harvests of plants, and leaves can be identified by position or stage of development on plants. Random sampling of leaves is not as good a technique as sampling based on position on plant, size, and age. Nitrogen is a mobile element in plants; hence, it moves from lower leaves to upper leaves, and analysis of lower leaves might be a better index of deficiency than analysis of upper leaves. Sometimes, young leaves or the first-fully expanded leaves are chosen for analysis because of convenience in identifying the sample and because the lower leaves might be dead or contaminated with soil. Deficient, sufficient, and high concentrations of nitrogen in the leaves of plants are reported in Table 2.4.
 |
Ratios of Concentrations of Nitrogen to Other Nutrients in Plants
The critical concentration of nitrogen is the value in a particular plant part sampled at a given growth stage below which plant growth and yield are suppressed by 5 or 10% (82). The responses of plants to nutrient additions are essentially independent of the source of nutrients; hence, the symptoms and nutrient concentrations of affected tissues, and relationships to growth and yields, are identical regardless of the growth medium or location. Therefore, the critical concentration is proposed to have universal application to media and geographic locations (82). However, since leaf (tissue) composition varies with age, the critical concentration can vary and be insensitive or inflexible to diagnosis of nutrient deficiency (83). For example, if a leaf sample is taken at an early plant-growth stage, the concentration of nitrogen may exceed the critical concentration that was determined for tissue at a later stage of growth. Likewise, a sample taken at a late stage of growth might mistakenly be diagnosed as indicating a deficiency of nitrogen. To deal with the problem of variable critical concentrations with plant age, several sets of critical values are needed, one for each growth stage. Determinations of critical concentrations are difficult because of the many observations that must be made of growth and yield in response to nutrient concentrations in leaves. Hence, few critical concentrations have been determined at one growth stage, not considering that multiple stages should be assessed. Applications of sufficiency ranges, such as those reported (Table 2.4), are often too wide to be used for precise diagnoses.
The Diagnostic and Recommendations Integrated System (DRIS) was developed to assess plant nutrition without regard to variety, age, or position of leaves on plants (83,84). The DRIS method considers nutrient balance and utilizes ratios of nutrient concentrations in leaves to determine the relative sufficiency of nutrients (85). The DRIS method differs from standard diagnostic methods in the interpretation of analytical results based on the concentrations of individual elements. Instead of considering each nutrient concentration independently, DRIS evaluates nutrient relationships that involve ratios between pairs of nutrients and evaluates the adequacy of a nutrient in relation to others. Generation of the DRIS index yields positive and negative numbers, which are deviations from a norm and which sum to zero for all nutrients considered. DRIS norms are standard values suggested to have universal application to a crop. Norms are determined by research and have been published for several crops (86).
The optimum range for plant DRIS indices is -15 to 15. If the index is below -15, that element is considered to be deficient. If the index is above 15, that element is considered to be in excess. DRIS indices must be interpreted in comparison with other nutrients. A negative number does not indicate that a nutrient is deficient, but it may be used to compare relative deficiencies among nutrients. DRIS may be useful in identifying hidden hunger or imbalances. For example, if nitrogen had an index of -12, phosphorus an index of -8, and potassium an index of 6, the order of likely growth-limiting effects would be nitrogen > phosphorus > potassium. Variations in DRIS (M-DRIS or modified DRIS) consider dry matter in generation of indices (87,88).


