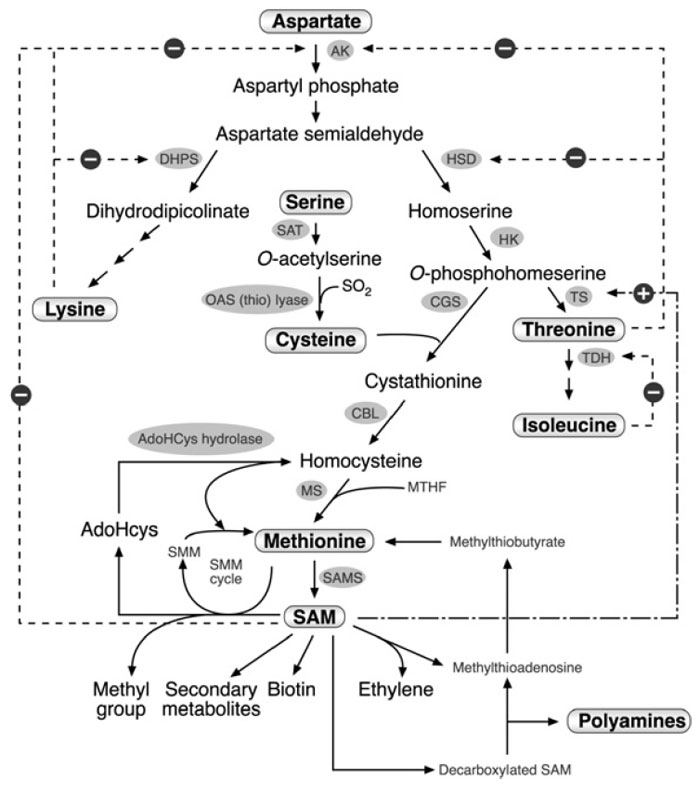
Interrelationships Between Threonine and Methionine Biosynthesis
Biochemical studies suggest that methionine biosynthesis is regulated by a competition
between CGS and TS for their common substrate
O-phosphohomoserine
(Amir
et al., 2002 and references therein). Plant TS enzymes possess approximately
250–500-fold higher affinity for
O-phosphohomoserine than the plant CGS
enzymes as measured by
in vitro studies (Curien
et al., 1998; Ravanel
et al.,
1998b). This indicates that most of the carbon and amino skeleton of aspartate
should be channeled toward threonine rather than to methionine. Indeed, when
the flux into the threonine/methionine branch of the heaspartate family was
increased by overexpressing a bacterial feedback-insensitive AK in transgenic
plants, threonine levels were greatly increased but methionine levels hardly
changed (Ben Tzvi-Tzchori
et al., 1996; Karchi
et al., 1993; Shaul and Galili,
1992b). SAM, the immediate catabolic product of methionine, may buffer the
competitive fluxes of threonine and methionine biosynthesis because it positively
regulates TS activity (Curien
et al., 1998).
Studies using transgenic plants support the biochemical studies for a competition
between the threonine and methionine branch of the aspartate family
pathway (Fig. 3.2). However, they also show that this competition is not simple.
Reduction of CGS level by gene silencing or antisense approaches resulted in a
3.3–8.3-fold increase in threonine levels in transgenic
Arabidopsis plants, while
methionine levels were only slightly reduced (Kim and Leustek, 2000; Kim
et al., 2002). In addition, reduction of TS activity due to a mutation in the TS
gene (
mto2–1 mutant) caused an ~16-fold reduction in threonine as well as a
comparable ~22-fold increase in methionine in rosette leaves compared to wildtype
Arabidopsis plants (Bartlem
et al., 2000). More remarkable results were
obtained when the TS levels were reduced by an antisense approach both in transgenic potato and
Arabidopsis plants (Avraham and Amir, 2005; Zeh
et al.,
2001). In the TS antisense transgenic potato plants, threonine levels were only
moderately reduced by up to ~45%, whereas methionine levels were dramatically
increased by up to ~239-fold compared to nontransformed plants (Zeh
et al.,
2001). Similarly, in the TS antisense transgenic
Arabidopsis plants, threonine levels
were only moderately reduced by approximately 1.5–2.5-fold, while the levels of
methionine increased by up to ~47-fold than in wild-type plants (Avraham and
Amir, 2005). The results imply that the reduction in TS levels, rather than its
activity as observed in the
Arabidopsis mto2 mutant, causes either an increased
flux of the carbon and amino skeleton from aspartate to methionine or a reduced
rate of methionine catabolism.
The complex competition between the methionine and threonine branches of
the aspartate family pathway was supported by additional studies. In the
mto1–1
mutants, the significant increases in methionine were not associated with a significant
reduction in threonine (Kim and Leustek, 2000). In addition, constitutive
overexpression of CGS in transgenic
Arabidopsis, potato, and tobacco plants
caused significant increases in methionine levels, but no significant compensatory
decreases in threonine levels (Gakiere
et al., 2000; Hacham
et al., 2002; Kim
et al.,
2002; Kreft
et al., 2003). These results may be explained by a differential ratelimiting
effect of
O-phosphohomoserine, the common substrate for CGS and TS
(Fig. 3.2), for threonine and methionine biosynthesis. The steady-state level of
O-phosphohomoserine may be more rate limiting for methionine than for threonine
biosynthesis. In addition, increased
O-phosphohomoserine utilization by
CGS may trigger an increase in the synthesis of this intermediate metabolite,
rendering it nonlimiting for threonine biosynthesis. This assumption is supported
by the analysis of
Arabidopsis and potato plants expressing the antisense form
of CGS. The level of
O-phosphohomoserine in these plants was increased by
~22-fold in
Arabidopsis, and from an undetectable level to 6.5 nmol/g fresh weight
in potatoes, while the level of threonine increased only by ~8-fold in
Arabidopsis,
or was not increased in potato plants (Gakiere
et al., 2000; Kreft
et al., 2003).
 |
| FIGURE 3.2 Schematic diagram of the metabolic network containing the aspartate family
pathway, methionine metabolism, and last two steps in the cysteine biosynthesis. Only some of
the enzymes and metabolites are specified. Abbreviations: AK, aspartate kinase; DHPS,
dihydrodipicolinate synthase; HSD, homoserine dehydrogenase; HK, homoserine kinase; TS,
threonine synthase; TDH, threonine dehydratase; SAT, serine acetyl transferase; OAS (thio)
lyase; O-acetyl serine (thio) lyase; CGS, cystathionine γ-synthase; CBL, cystathionine β-lyase;
MS, methionine synthase, SAM, S-adenosyl methionine; SAMS, S-adenosyl methionine
synthase; AdoHcys, adenosylhomocysteine; SMM, S-methyl methionine; MTHF, methyltetrahydrofolate.
Dashed arrows with a ‘‘minus’’ sign represent feedback inhibition loops of key enzymes
in the network. The dashed and dotted arrow with the ‘‘plus’’ sign represents the stimulation of TS
activity by SAM. |


