Analysis of Tumor Cell Invasion in Organotypic Brain Slices Using Confocal Laser-Scanning Microscopy
Organotypic cultures of nervous tissue, including those of the hippocampal and cortical regions, have been produced successfully with a simple method in which brain slices are maintained in a culture at the interface between air and culture medium (Yamamoto et al., 1989, 1992; Stoppini et al., 1991; Tanaka et al., 1994). In these organotypic brain slice cultures, not only is the normal cytoarchitecture such as cortical lamination and pyramidal cells preserved, but the biochemical and electrophysiological properties of neuronal cells are also maintained for 2 or 3 months. By modifying this organotypic culture of nervous tissues, we established a model for glial tumor cell invasion with conditions analogous to those of normal brains in situ (Ohnishi et al., 1998; Matsumura et al., 2000). This model enables not only to quantitatively analyze the tumor cell invasion in brain tissues, but also to investigate molecular events in vitro (events actually occur between transplanted cells and brains in vivo).
Hanks' balanced salt solution (HBSS) (Cat. No. H9269), Eagle's minimum essential medium (MEM) with HEPES (Cat. No. M7278), D-glucose (Cat. No. G7021), penicillin-streptomycin solution (Cat. No. P0781), amphotericin B (Cat. No. A2942), propidium iodide (PI) (Cat. No. P4170), L-glutamine (Cat. No. G5763), N-methyl-D-aspartate (NMDA) (Cat. No. M3262), and agar (Cat. No. A5431) are from Sigma. Dulbecco's phosphate-buffered saline, calciummagnesium free [PBS(-), pH 7.4] (Cat. No. 14190-250), horse serum (Cat. No. 16050-122), and fetal bovine serum (FBS) (Cat. No. 16000-044) are from Invitrogen Corp. Culture plate inserts with a 0.4-µm-pore membrane, 30mm (Millicell-CM) (Cat. No. PICM 030 50) are from Millipore Corp. Six-well culture plates (Cat. No. 3506), 60-mm culture dishes (Cat. No. 430166), and 100-mm culture dishes (Cat. No. 430167) are from Corning. The PKH2 fluorescent cell staining kit is from ZYNAXIS Cell Science. C6 rat glioma cells and T98G human glioma cells are from American Type Culture Collection. For these cell cultures, Ham's F10 powder (Cat. No. N6635) and MEM (Cat. No. M4655) are from Sigma.
III. PROCEDURES
A. Preparation of Brain Slice and the Oraganotypic Culture
This procedure is modified from the method of Stoppini et al. (1991).
Scissors (large one for decapitation and small one for dissection of brains)
Microforceps with fine chips
10% povidone-iodine solution
Phoshate-buffered saline without calcium and magnesium (pH 7.4)
Microslicer with a sliding cut mode (possible to cut nonfrozen fresh brains with a range of 50 to 1000 µm thick)
Culture plate inserts with 0.4µm-pore membranes (30mm in diameter) (Millicell-CM)
Six-well culture plates (35 mm in diameter/well)
60-mm culture dishes
CO2 incubator
Culture medium: 50% Eagle's MEM (Earle salt with L-glutamine, 25µM HEPES, and NaHCO3), 25% HBSS, 25% heat-inactivated horse serum, 6.5 mg/ml D-glucose, 100U/ml penicillin, 100µg/ml streptomycin, and 2.5µg/ml amphotericin B. To make 200ml, add 96ml of a Eagle's MEM solution, 50ml of HBSS, 50ml of horse serum, 1.3 g of D-glucose, 2ml of a penicillin (10,000U/ml)-streptomycin (10mg/ml) solution, and 2ml of an amphotericin B solution (250µ/ml). Keep at 4°C.
- Anesthetize a 2-day-old neonatal rat with diethyl ether and plunge into a 10% povidone-iodine solution.
- Cut off the head with large scissors, remove the skin and the skull with a small scissors, and take out the whole brain quickly and place in a 60mm culture dish with HBSS.
- Cut the brain vertically to the base, 1 mm inward from both rostral and caudal ends of the cerebrum with a blade, and mount on the stage of a microslicer, which is sterilized with 70% ethyl alcohol.
- 300-µm-thick cut brain slices and transfer each slice onto a porous (0.4µm pore size) membrane of a culture plate insert, which is placed in a well of a sixwell culture plate filled with PBS.
- After aspiration of PBS from the outer well of the six-well culture plate, add 1 ml of culture medium to the outer well but without covering the brain slice placed on the membrane.
- Incubate the brain slice at 37°C under standard conditions of 100% humidity, 95% air, and 5% CO2.
- After 3 days of the culture, replace half of the medium with fresh medium twice a week. Reduce the volume of the medium after the second change to 0.8 ml so that the slices remain well exposed to the air. (This is critical for long-term survival of the neuronal cells.) (Fig. 1).
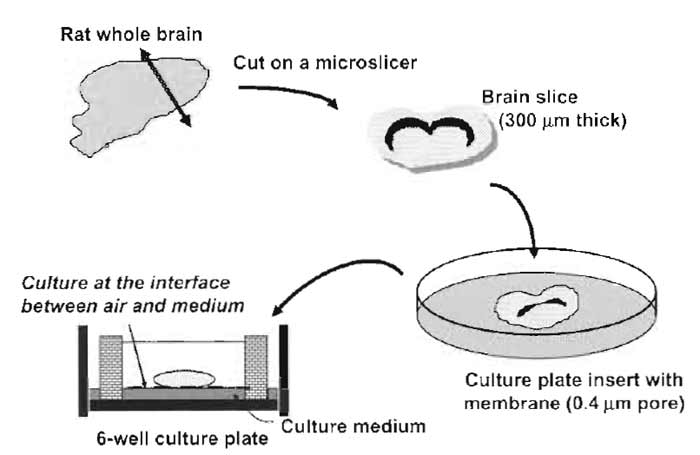 |
| FIGURE 1 Illustrative procedures of brain slice culture. A rat whole brain slice 300µm thick is placed on a porous membrane affixed to the culture plate insert and cultured at the interface between air and culture medium. |
B. Assessment of Viability of Brain Slices
The viability of cultured brain slices can be assessed by morphological observation, neuronal activity, electrophysiological features, and production of bioactive substances such as γ-aminobutyric acid and neuropeptides. Normal cytoarchitecture such as cortical lamination and hippocampal structure is clearly observed for about 2 months after the slice culture if the culture condition is kept properly (Fig. 2). This section describes the method used to assess the neuronal viability of brain slices by NMDA insult that can induce early and delayed neuronal cell death (Sakaguchi et al., 1996).
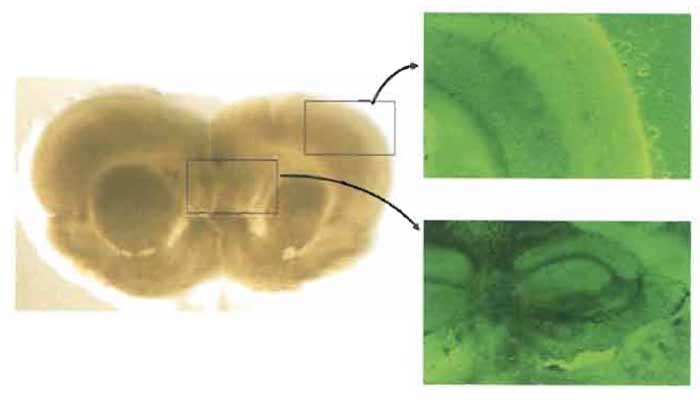 |
| FIGURE 2 Morphological pictures of a rat brain slice after 8 days of culture. Normal cytoarchitecture, including cortical lamination and hippocampal structure, is clearly observed (left: macroscopic picture, ×0.5; right: phase contrast, ×40). |
100 µM N-methyl-D-aspartate solution: Dissolve 1.47 mg of NMDA in 100ml of artificial cerebrospinal fluid (CSF). Prepare artificial CSF from three stock solutions, A, B, and C, before use. Stock solution A consists of 18.12g of NaCl, 0.488g of NaH2PO4·2H2O, 0.932 g of KCl, and 1.232 g of MgSO4·7H2O in 100ml of H2O. Stock solution B contains 2.22 g of CaCl2 in 100 ml of H2O, and stock solution C contains 4.62 g of NaHCO3 in 100ml of H2O. Store at 4°C.To make 100 ml of artificial CSF, add 4 ml of stock solution A, 4 ml of stock solution C, and 91 ml of H2O and then place the mixed solution under the current of 95% air and 5% CO2 to lower the pH of the solution. Then, add 1 ml of solution B and 0.18g of D-glucose to the mixed solution (the final pH is 7.4).
4.6µg/ml propidium iodide solution. Dissolve PI in a serum-free solution containing 75% MEM, 25% HBSS, 2mM L-glutamine, and 6.5 mg/ml D-glucose to a final concentration of 4.6µg/ml.
Fluorescence microscope with a tetramethylrhodamine isothiocyanate (TRITC) filter
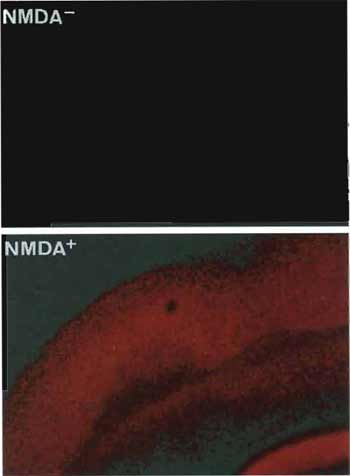 |
| FIGURE 3 Neuronal viability of rat brain slices assessed by cellular uptake of propidium iodide (PI) without (upper) and with (lower) treatment of N-methyl-D-aspartate (NMDA). Normally functioned neurons can exclude PI and show early or delayed neuronal cell death by NMDA insult, thus permitting entry of the PI into the cells. |
- Incubate brain slices in 1 ml of the artificial CSF solution containing 100 µM NMDA, which is placed in the bathing well of a six-well culture plate for 15 min. Incubate the slices in PI solution for 1 h to measure early neuronal death or for 24h to measure delayed neuronal cell death.
- View PI signals under a fluorescence microscope with a TRITC filter.
- As a control, incubate brain slices in PI solution for 1 h or 24 h following incubation in the CSF solution without NMDA for 15 min. (Fig. 3).
C. Preparation of Tumor Cell Spheroids
Tumor Cells, Solutions, and Instruments
Tumor cells in culture and their culture medium (Ham's F10 medium containing 10% FBS is used for C6 rat glioma cells, and MEM supplemented with 1% nonessential amino acid, 1% sodium pyruvate, and 10% FBS is used for T98G human glioma cells)
PKH2 fluorescent cell-staining kit
1.25% agar-coated culture dish (100mm in diameter)
Place 5 ml of 1.25% agar solution on a culture dish and
dry under air.
Reciprocating shaker (usable in a CO2 incubator)
CO2 incubator
- Grow tumor cells as a monolayer culture under standard conditions.
- Harvest the tumor cells by trypsinization, wash twice, and resuspend in labeling diluent "A" (provided with the PKH2 staining kit) at a concentration of 2 × 10⁷ cells/ml (cell/diluent suspension).
- Add PKH2 dye to an equal volume of diluent "A" to make a 4 µM solution. Add this solution to the cell/diluent suspension and mix by gentle agitation.
- After incubating the cells at room temperature for 5 min, stop the labeling reaction by adding a double volume of the culture medium containing 10% FBS and four times the volume of FBS into the sample tubes.
- Wash the cells and resuspend in the culture medium with 10% FBS.
- Seed the labeled tumor cells (5 × 10⁶) into a 1.25% agar-coated culture dish and incubate under continuous agitation at a speed of 40rpm on a reciprocating shaker at 37°C in a humidified atmosphere of 5% CO2 and 95% air for 2 to 3 days.
- For the experiments, select cell aggregates with a size of 150 to 200 µm.
D. Migration Assay of Tumor Cells on Brain Slices (Fig. 4)
Instuments and Molecules
Barin slices after 7 days culture
Tumor cell spheroids
Micropipette with a volume of 10µm
Molecules or agents affecting cell migration
Fluorescence microscope with a FITC filter
Color-chilled 3-CCD camera
Personal computer
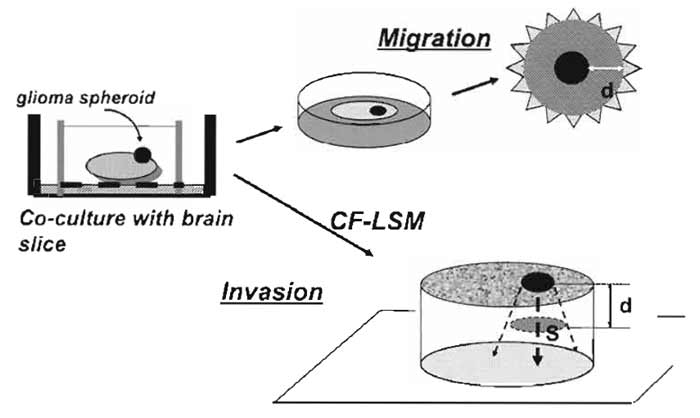 |
| FIGURE 4 Illustrative procedures of tumor cell migration and invasion assay in cocultured brain slices. A tumor (glioma) spheroid is placed on the brain slice and is cocultured at the interface between air and culture medium. For tumor cell migration, the extent of the spread of fluorescent dye-stained tumor cells on the surface of the slice is measured. For tumor cell invasion, the spatial extent of the tumor cell infiltration in the slice is analyzed by confocal laser-scanning microscopy (CF-LSM). d, distance; S, area. |
- Using a micropipette, take one spheroid of tumor cells place on the surface of brain slice, and coculture at 37°C under standard conditions.
- Four hours later, apply 2 µl of molecules in investigation directly to the tumor spheroid. Carry out the application of the molecule once a day for 3 to 6 days.
- To estimate the extent of cell migration, calculate the distance between the margin of the initially placed spheroids and the population of the migrating cells showing half of the density (area) of the maximum density of migrating cells from the tumor spheroid by using computer images for which the original fluorescent pictures of the slices are taken with a color-chilled 3-CCD camera.
- For this calculation, draw concentric circles 10µm apart around the margin of the spheroid and measure cell density (area of fluorescence-stained cells) within each ring by an NIH image. Then, do the summation of area of the cells contained in each ring and plot as a function of the distance from the margin of the tumor spheroid. Thus the distribution curve of migrating cells outside the spheroid is constructed for each brain slice (Fig. 5). The migratory strength of the cells on the slice is defined as the distance (µm) that shows half of the value of the maximum density (area) of migrating cells on the distribution curve.
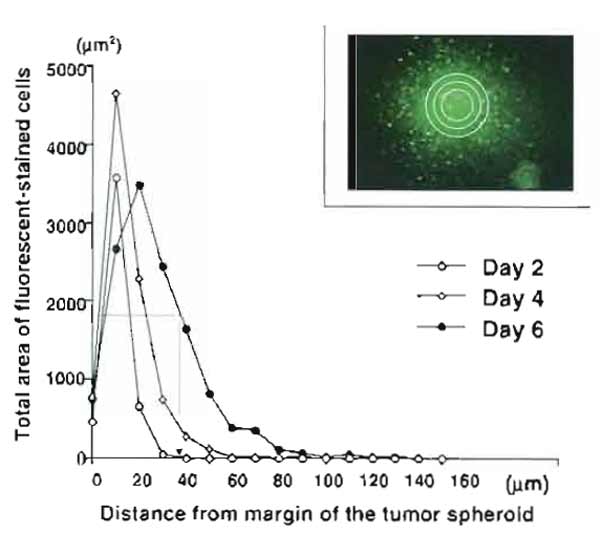 |
| FIGURE 5 Construction of distribution curves of migrating cells for a quantitative analysis of tumor cell migration in brain slices. The total area of the labeled cells contained in each ring is plotted as a function of the distance from the margin of the tumor spheroid. (Inset) Concentric circles 10µm apart are drawn around the margin of the tumor spheroid, and cell density (area of fluorescent-stained cells) within each ring is measured by an NIH image. Distribution curves represent Ll-stimulated C6 glioma migration at day 2, day 4, and day 6 after the coculture with brain slices. The migratory strength of the cells is determined as the distance (µm) that shows half of the value of the maximum density (area) of migrating cells on the distribution curve (see the distribution curve on day 6). |
Instruments
Barin slices after 7 days culture
Tumor cell spheroids
Micropipette with a volume of 10µm
Inverted confocal laser-scanning microscope with FITC filter optics
Personal computer
Steps
- With a micropipette, take one spheroid of tumor cells tagged with the PKH2-fluoresent dye, place on the surface of brain slice, and coculture at 37°C under standard conditions.
- To detect PKH2-stained tumor cells in brain slices, use an inverted confocal laser-scanning microscope with FITC (520nm) filter optics.
- At the first observation, determine the level of the basal plane (0µm) in accordance with the upper surface of the brain slice.
- Obtain serial sections every 20µm downward from the basal plane to the bottom of the slice (Fig. 6).
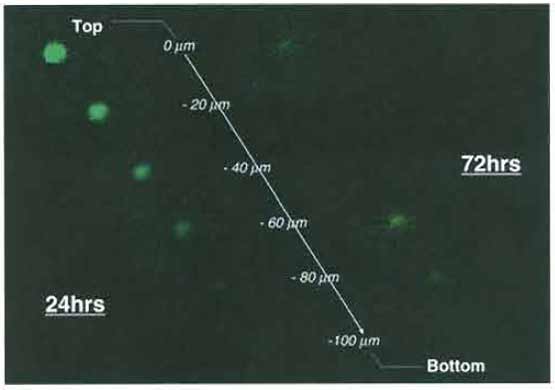 |
| FIGURE 6 Confocal laser-scanning microscopic pictures of invading glioma cells in rat brain slices. At 24h after coculture of T98G glioma spheroid and the brain slice, most glioma cells remain at the top of the slice (0µm), while the glioma cells migrate extensively within the brain slice (show the maximum spread at -40 µm from the top of the slice) at 72h after coculture. |
F. Quantitative Analysis of Tumor Invasion
The total area of PKH2-stained cells in each section is calculated with NIH image software. The area is plotted as a function of the distance from the basal plane of the brain slice and the distribution curve is constructed for each experiment. The extent of tumor cell invasion in the slice is defined as the depth (µm) that shows half of the maximum density (area) of invasive cells on the distribution curve.
- As a source of brain slices, brain tissues from mice and humans (obtained from epilepsy surgery) are also applicable. In the case of rats, 2- to 5-day-old neonatal brains are best. As brains from much younger rats are smaller and more soft, it is difficult to manuplate the whole brain as intact slices. Brains prepared from rats of an older age have a tendency to be resistant to tumor invasion into the slices.
- For about 4-5 days after initiating the brain slice culture, several neuronal death and glial cell migration to the bottom of the slices occur. After 5 days in culture, the exposure of slices to PI alone without NMDA insult does not elicit a detectable fluorescence signal. Therefore, for tumor invasion experiments, brain slices after 5 days in culture should be used. Usually, brain slices after 7 days in culture are used for any kind of studies. At this time, the thickness of the brain slices is reduced to about 200 µm from the original thickness of 300 µm. Brain slices maintain their normal structures, such as cortical lamination, and are functionally viable for about 2 months after the culture, but it seems that the best time for experiments is from 7 to 30 days after culture.
- To detect migrating tumor cells in the brain slice, a tumor-labeling method using green fluorescent protein (GFP) is also applicable. Once tumor cell clones with persistent expression of GFP are established, their use is of great advantage in analyzing the behavior of the tumor cells because the GFP is transmitted to the tumor cells after cell division. An EGFP vector (pEGFP-C1, obtained from Clonetics Corp., San Diego, CA) can be used to transfect and label malignant glioma cells.
References
Matsumura, H., Ohnishi, T., Kanemura, Y., Maruno, M., and Yoshimine, T. (2000). Quantitative analysis of glioma cell invasion by confocal laser scanning microscopy in a novel brain slice model. Biochem. Biophys. Res. Commun. 269, 513-520.
Ohnishi, T., Matsumura, H., Izumoto, S., Hiraga, S., and Hayakawa, T. (1998). A novel model of glioma cell invasion using organotypic brain slice culture. Cancer Res. 58, 2935-2940.
Stoppini, L., Buchs, P.-A., and Muller, D. (1991). A simple method for organotypic cultures of nervous tissue. J. Neurosci. Methods 37, 173-327.
Tanaka, M., Tomita, A., Yoshida, S., Yano, M., and Shimuzu, H. (1994). Observation of the highly organized development of granule cells in rat cerebellar organotypic cultures. Brain Res. 641, 319-327.
Yamamoto, N., Kurotani, T., and Toyama, K. (1989). Neural connections between the lateral geniculate nucleus and visual cortex in vitro. Science 245, 192-194.
Yamamoto, N., Yamada, K., Kurotani, T., and Toyama, K. (1992). Laminar specificity of extrinsic cortical connections studied in coculture preparations. Neuron 9, 217-228.


