Cellular Assays of Oncogene Transformation
A critical step in the validation of the role of candidate oncogenes in oncogenesis involves a demonstration of their ability to endow nonneoplastic cells with growth properties characteristics of tumor cells. The most widely utilized model system for the analyses of oncogene function involves the use of NIH 3T3 mouse fibroblasts. NIH 3T3 mouse fibroblasts have been a useful model cell system to evaluate transformation caused by aberrant activation of many different functional classes of oncogenes, including serine/threonine (e.g., Raf) and tyrosine (e.g., Src) protein kinases, nuclear transcription factors (e.g., Fos), G-proteincoupled receptors (GPCRs; e.g., Mas, PAR1), and small (e.g., Ras) and large (e.g, Gα12) GTPases. This article describes the application of various cellular assays for the study of growth transformation caused by GPCR oncogenes that promote the aberrant activation of Rho family small GTPases.
In addition to their abilities to induce tumorigenesis, Ras and Rho family proteins have attracted considerable research attention as important mediators of tumor cell invasion and metastasis. For example, previous studies from our laboratory determined that Racl, Cdc42, and RhoA can promote breast cancer cell invasion (Keely et al., 1997), while Hynes and colleagues showed that upregulation of RhoC promoted metastatic growth of melanoma cells (Clark et al., 2000). Therefore, the second section of this article describes assays to examine human tumor cell invasion in vitro induced by the activation of Rho family proteins. The applications described can be used to implicate GPCRs, direct activators of Rho family members, and Rho proteins themselves as important for promoting cellular invasion.
Three types of focus formation assays can be used to evaluate the transforming potential of oncoproteins that cause persistent activation of Rho family proteins (Clark et al., 1995; Solski and Der, 2000). The most commonly used assay is the primary focus formation assay, which provides a straightforward method for quantitation of transforming potential. A second assay is a primary focus formation cooperation assay, where activated Raf is coexpressed along with the oncogene under evaluation. Our laboratory and others showed that Rho GTPase activators cooperate with activated Raf and cause synergistic focus forming activity (Khosravi-Far et al., 1995; Qiu et al., 1995). A third type of assay involves the establishment of cells stably expressing an oncoprotein of interest, which can be used in secondary focus-formation assays, as well as in additional assays to examine other aspects of cellular transformation. These additional assays are used to evaluate the loss of density-dependent inhibition of growth, loss of anchorage-dependent growth, reduced requirement for growth factors, and tumorigenic growth potential in immunodeficient mice.
NIH 3T3 mouse fibroblasts: There is considerable variation in the growth properties of different isolates of NIH 3T3 cells. Consequently, the assays described here apply specifically to the strain used in our assays and were obtained originally from Dr. Geoffrey M. Cooper (Boston University). We have described detailed protocols for the routine culture techniques for the maintenance and long-term storage of NIH 3T3 cells previously (Clark et al., 1995).
1.25M CaCl2: Autoclave to sterilize and store at room temperature.
HEPES-buffered saline (HBS), pH 7.05: To 900ml of distilled H2O, add 8.0g of NaCl, 0.37g KCl, 0.19g Na2HPO.7H2O, 1.0g glucose, and 5M NaOH. Adjust the volume to 1 liter, autoclave to sterilize, and store at room temperature. The correct pH is critical to generating a good DNA precipitation.
45% glycerol/HBS: Mix autoclaved glycerol and HBS at 45:55 (v/v) and store at room temperature.
Carrier DNA: High molecular weight carrier DNA (e.g., calf thymus) is required to facilitate the formation of calcium phosphate precipitate of the transfected plasmid DNA. Prepare a 1-mg/ml stock in sterile H2O and store at -20°C.
Transfection Protocol
This protocol describes a 20 dish transfection assay, where duplicate dishes are used for each experimental condition. This assay involves one set of dishes to control for the appearance of spontaneous transformed foci (empty vector control) and one set of dishes for a positive control. An expression plasmid encoding activated Ras [e.g., pZIP-H-ras(61L)] (20ng per dish) is generally used as a positive control.
Ras-induced foci should be readily visible after 7 to 10 days, whereas various Dbl or Rho family proteininduced foci may not be visible until 14 to 21 days (Booden et al., 2002; Martin et al., 2001) (Fig. 1A). Rinse the cells once with phosphate buffered saline (PBS) and fix with 2 ml per dish of 10% (v/v) acetic acid and 10% (v/v) methanol in H2O. Once the cells are fixed, they can be quantitated at a later time (on day 14 for Ras, day 21 for Rho). This fixation procedure does not alter the morphology of the foci. Another less accurate and sensitive method of counting involves staining the fixed cells with crystal violet (0.4% in ethanol) to visualize the foci.
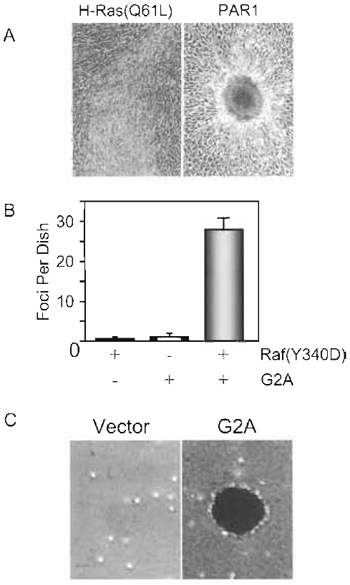 |
| FIGURE 1 NIH 3T3 transformation assays. PAR1 and G2A are GPCRs that cause transformation by activation of RhoA. (A) NIH 3T3 focus formation assay. Appearance of foci of transformed cells caused by mutationally activated H-Ras(Q61L) and the PAR1 GPCR. PAR1 causes transformation, in part, by activation of the RhoA small GTPase. Ras causes the appearance of foci that contain highly refractile, spindle-shaped cells that form a well-spread focus of proliferating, multilayered cells. Like activated RhoA, PAR1 causes the appearance of foci that consist of nonrefractile cells that form a tight well-contained focus of proliferating, mutilayered cells. (B) NIH 3T3 focus cooperation assay. Coexpression of activated Raf(Y340D) together with G2A caused synergistic enhancement of focus formation. (C) NIH 3T3 soft agar assay. NIH 3T3 cells transfected stably with the empty vector or encoding G2A were suspended in soft agar to evaluate anchorage-independent growth potential. |
A. Cooperation and Secondary Focus Formation Assays
Because GPCRs require agonist stimulation and generally display weak or no focus forming activity when assayed in primary transfection assays, two other focus formation assays that provide a more sensitive detection of transforming activity are used routinely in our laboratory. The first assay is a cooperation, primary focus-formation assay utilizing activated Raf. For these assays, we typically use the weakly transforming Y340D mutant of human c-Raf-1 (Fabian et al., 1993). When transfected alone, this mutant displays little or no focus-forming activity (Fig. 1B). However, coexpression of Raf(Y340D), together with ligand-activated GPCRs, activated Rho GTPases, or activators of Rho GTPases (at concentrations that alone result in no focus-forming activity), will cause focus-forming activities that range from severalfold to more than 10- to 50-fold above their additive activity. For these assays we combine I btg per dish of pZIPraf( Y340D) along with 1 µg per dish of plasmid DNA encoding either the activated Rho GTPase or the Rho GTPase activator. Trial assays with different amounts of each plasmid should be performed to optimize the assay conditions to obtain the maximum level of cooperation. The appearance of transformed foci from these cooperation assays is distinct from those caused by Raf alone. However, foci arising from the specific activated GPCR, Rho family protein, or Rho family activator can range from typical Rho-like foci to those that exhibit a refractile appearance similar to that caused by activated Ras or Raf.
Other activated Raf-1 mutants have been used in this assay, such as membrane-targeted Raf (Raf- CAAX) or amino-terminally truncated (Raf-22W). However, these constitutively activated variants of c- Raf-1 possess potent focus-forming activities that are comparable to those of activated Ras mutants. Thus, small changes in transfection efficiency or DNA concentrations can cause the appearance of significant numbers of foci on cultures transfected with activated Raf alone. Therefore, use of the Raf(Y340D) is advantageous because it is easier to achieve Raf-transfectedonly dishes that contain no transformed foci.
The second type of focus formation assay is a secondary focus formation assay, which employs NIH 3T3 cells stably expressing a weakly transforming oncoprotein. For the secondary assay, plate 106 untransfected NIH 3T3 cells onto 60-mm dishes and incubate overnight to form a monolayer. The next day, plate 103 NIH 3T3 cells stably transfected with an expression vector encoding the oncogene protein under evaluation on top of the monolayer and stimulate with ligand if the oncoprotein is a GPCR. The efficiency of the stably transfected cells to form colonies is reflected by the appearance of densely packed cells within the monolayer of untransfected NIH 3T3 cells. The cultures should be fed every 2 days with growth medium and ligand as indicated. The appearance of foci is quantitated after 7-10 days. A variation on this assay is to simply plate the stably transfected cell populations at 105 cells per dish and then maintain the cultures for 2 weeks. Cells stably transfected with the empty expression vector provide the negative control for this assay.
B. Growth in Soft Agar
The acquisition of anchorage-independent growth potential is an essential step for tumor cell progression (Hanahan and Weinberg, 2000). Colony formation in soft agar is the most widely used assay to evaluate anchorage-independent growth in vitro and correlates strongly with in vivo tumorigenic growth potential. Untransformed NIH 3T3 cells need to adhere to a solid matrix in order to remain viable and proliferate. NIH 3T3 cells transformed by activated Ras and Rho GTPases lose this requirement, which results in their ability to form proliferating colonies of cells when suspended in a semisolid agar.
Materials and Reagents
1.8% Bacto-Agar (Difco 214050): Prepare a 1.8% stock (w/v, in distilled water) by boiling the solution in a microwave to dissolve the agar. Place 50-ml aliquots in 100-ml bottles and autoclave to sterilize. Store at room temperature. Microwave to melt.
2× DMEM: 2× DMEM and other culture medium components can be purchased from GIBCO (Invitrogen Life Technologies).
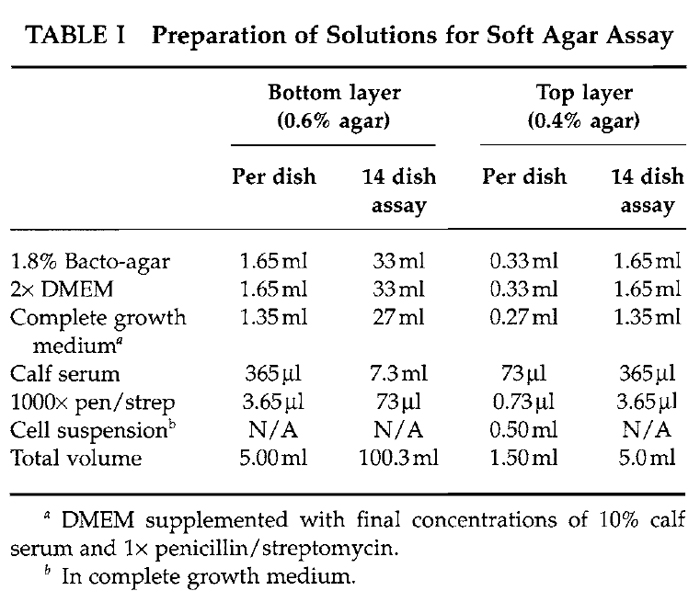
This modified protocol is based on a similar protocol described previously (Clark et al., 1995). Aliquot a layer of bottom agar (0.6% in growth medium) and allow to solidify. Trypsinize the cell lines of interest to generate a single-cell suspension, count, and resuspend in a layer of top agar (0.4% in growth medium). For weakly transforming Dbl family proteins or GPCRs, it is best to resuspend 104 to 105 cells per plate in the top agar layer given that they cause a low efficiency of colony formation. Further, if these analyses require stimulation with a ligand or pharmacological inhibition of a specific signaling pathway, the ligand or drug should be added to both the top and the bottom layers of agar.
Compared to Ras-transformed cells that develop colonies within 10 days, Dbl and GPCR-induced colonies are only visible after 21 to 30 days (Fig. 1C). Therefore, it is important to include both a positive (Ras-transformed cells) and negative (empty vectortransfected) control cell population. These controls are also important given that it is very easy to kill the cells if the agar solution is too hot or is made incorrectly. The following section describes the procedure to prepare reagents for a 14 dish assay where duplicates are used for each condition; one set would be used for a negative control, one set for a positive control, and five sets for five cell lines or experimental conditions.
Melt the sterile 1.8% Bacto-agar stock solution in a microwave and place in a 55°C water bath to cool. Place the complete growth medium, 2× DMEM, and calf serum in a 37°C water bath to prewarm.
Trypsinize each set of cells and transfer to a sterile 15-ml conical tube. Spin the cells out of the trypsin and resuspend in complete growth medium. Count the cells and transfer anywhere from 5 × 10³ to 105 cells per 0.5 ml to a 5-ml Falcon tube. The appropriate cell densities should be optimized for each cell line. Place the cell suspension in a 37°C water bath to prewarm while preparing the top agar layer.
To prepare 5ml of the top agar layer, combine 1.65 ml of 2× DMEM, 1.35 ml growth medium, 365 µl serum, and 3.65 µl of 1000× penicillin/streptomycin in a 15-ml conical tube and place in a 37°C water bath to prewarm. If the experimental conditions require the addition of a ligand or inhibitor, those compounds should be added before the solution is prewarmed. Add 1.65ml of the melted 1.8% Bacto-agar cooled to 55°C and mix. Quickly add 1 ml of the top agarmedium solution to the 0.5-ml cell suspension and gently pipette the cell agar/solution onto the solid bottom agar layer. Allow the top agar to solidify for 30min at room temperature and then transfer to a 37°C humidified 10% CO2 incubator. Feed each dish with 2 to 3 drops of complete growth medium every 2 to 3 days.
 |
III. in vitro CELLULAR INVASION ASSAYS
Three general types of in vitro assays can be used to assess the invasive potential of oncogene proteins that cause activation of Rho GTPases. The first and most widely used assay is the Matrigel transwell invasion assay, which provides quantitation of invasive potential. A second set of assays involves qualitative assessment invasive capabilities. These assays evaluate basal cellular invasion and correlate with in vivo metastatic potential. This section describes the analyses of human tumor cells where invasion is mediated, in part, by the persistent activation of Rho GTPase function by upstream activation of the PAR1 GPCR.
Human breast carcinoma cell lines: Obtain from ATCC and culture according to their recommended media. Maintain MDA-MB-231 cells in DMEM supplemented with 10% fetal bovine serum. Maintaine MCF-7 cells in α-MEM supplemented with 10% FBS and 10µg/ml insulin.
Matrigel invasion chamber: Purchase BD BioCoat growth factor reduced (GFR) Matrigel invasion chambers with a 8-µm pore size PET membrane (Cat. No. 354483) from BD Biosciences.
G8 Myoblasts: Maintain mouse fetal G8 myoblasts (American Type Culture Collection, Rockville, MD) in DMEM supplemented with 10% fetal calf serum and 10% horse serum and grow at 37°C with 10% CO2. Cells should be subcultured when they reach 70-80% confluency to avoid alterations in the growth properties of the cells.
Matrigel: Purchase Matrigel from Collaborative Biomedical Products (Cat. No. 356234)
Cell dissociation media: Enzyme-free cell dissociation solution PBS based (1× liquid) can be purchased from Specialty Media (Cat. No. S-014-B)
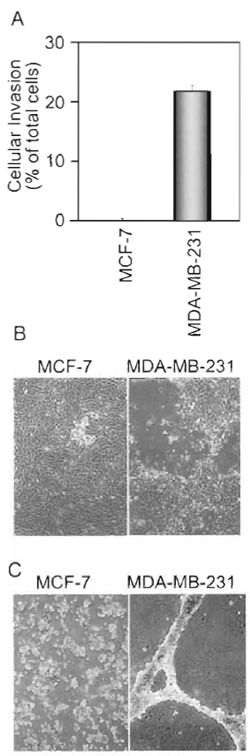 |
| FIGURE 2 in vitro invasion assays. The behavior of noninvasive MCF-7 (low PAR1 expression) and highly invasive MDA-MB-231 (high PAR1 expression) human breast carcinoma cells was evaluated in the Matigel transwell invasion assay (A), the G8 myoblast invasion assay (B), or the two-imensional Matrigel invasion assay (C). |
This modified assay is based on a similar protocol described previously (Albini et al., 1987) and it should be emphasized that it is extremely important to optimize the starvation, cell density, and chemoattractant conditions for each cell line used in this assay. For example, we have determined that to assay the invasive potential of MDA-MB-231 cells, the cells must be starved in serum-free medium for a minimum of 24 h and no more than 5 × 10³ cells per well should be added to the upper chamber of the Matrigel transwell chamber. If these conditions are not used, we have found that too many cells invade into the Matrigel to accurately quantitate. Therefore, we have described the procedures and amounts of MDA-MB-231 cells required for a 12 transwell chamber assay, where duplicate dishes are used for each experimental condition. This would involve one set of chambers for a positive control, one set for a negative control, and four sets for experimental conditions. We usually use MDA-MB-231 as a positive control and MCF-7 cells as a negative control (Booden et al., 2003) (Fig. 2A). For the negative control, we generally seed 2 × 10⁵ cells per 0.5 ml in the upper chamber of each transwell.
Matrigel is a solubilized basement membrane preparation extracted from the Engelbreth- Holm-Swarm (EHS) mouse sarcoma cell line, which gels quickly at room temperature to form a reconstituted basement membrane. The growth factorreduced (GFR) Matrigel is a more defined and characterized reconstituted basement membrane than Matrigel. Remove GFR Matrigel invasion chambers from -20°C and gently add 0.5ml of starvation medium to the inner chamber. Allow the Matrigel to rehydrate for 2h at 37°C Once the Matrigel is rehydrated, it is important not to let it dry out. Therefore, do not remove the rehydration medium until it is time to add the cell suspension to the upper chamber.
While the Matrigel is rehydrating, dissociate the serum-starved cells of interest with enzyme-free cell dissociation media. We use the enzyme-free dissociation medium instead of trypsin, as trypsin can act as a mitogen that stimulates multiple signaling pathways, including GPCRs, that can cause Ras and Rho GTPase activation. Make sure to rinse the cells thoroughly with calcium-free PBS and, if need be, incubate them in calcium-free PBS for 5 to 10 min at 37°C before stimulating with enzyme-free dissociation medium. This incubation will facilitate a more rapid dissociation of the cells and will decrease the sheeting of epithelial cells, making them easier to count and plate. Spin the cells out of the dissociation medium and prepare cell suspensions in starvation medium containing 1% BSA and 10 mM HEPES at 104 cells/ml. For each transwell chamber, add 750µl of medium to the bottom well of the 24-well companion plate. Remove the base medium from the inner chamber with a pipette, one chamber at a time, and immediately add 0.5 ml of cell suspension (5 x 10³ cells) to the inner chamber. Transfer the Matrigel chambers to the wells containing the starvation medium. If these assays require receptor stimulation, allow the cells to incubate for 30min and then stimulate with the ligand of interest. Be sure that no air bubbles are trapped beneath the membrane. Air bubbles will impede cells from invading through the Matrigel. Incubate the Matrigel transwell chambers for 24h at 37°C and 5% CO2.
Cells on the lower surface of the membrane should be fixed and stained. We use a Diff-Quick Kit (Dade Behring Inc.) to stain the cells on the lower surface of filter. With this kit, the cell nucleus stains purple and the cytoplasm stains pink. Alternative staining methods include fixation followed by hematoxylin and eosin or crystal violet. To fix and stain the cells using the Diff-Quick kit, add 750ml of each Diff-Quick solution to three individual wells in a 24-well plate and add distilled water to two beakers. Immediately after removal of noninvading cells and Matrigel, sequentially transfer the transwell chambers, every 45s, through each stain solution and the two beakers of water. Remove excess solution by gently swabbing the inner chamber with a cotton tip and allow the inserts to air dry for a minimum of 60min.
Depending on the proportion of cells that invade, quantitation can be done by directly counting the stained cells by visual inspection using a phase-contrast microscope. We generally place the chamber on a grid and count the stained cells on one-half of the filter of duplicate membranes at 10x magnification. It is also important to examine the bottom well for cells that have invaded through the Matrigel but did not adhere to the filter. This phenomenon is quite common for highly invasive breast carcinoma cell lines such as MDA-MB-231, BT549, and Hs578T. Quantitate these cells using a hemacytometer. We do not recommend removing the membrane from the insert housing as the filter generally tears.
G8 monolayer invasion provides a simple and highly reproducible assay to test the ability of tumor cells to invade a monolayer that is enriched in a variety of extracellular matrix components. This provides a qualitative assay that monitors activity that correlates well with in vivo metastasis. The G8 myoblast assay was determined to correlate with the invasive and metastatic ability of TA3/St mouse mammary carcinoma cells in vivo (Yu and Stamenkovic, 1999; Yu et al., 1997). While they cannot be employed to directly quantitate in vitro invasion mediated by a specific protein or signaling pathway, the G8 myoblast and two-dimensional Matrigel assays report the ability of cells to invade and degrade extracellular matrix, as well as the cell monolayer that has deposited the matrix proteins, and, more importantly, they report the ability of the cells to organize, move through an unnatural environment, and proliferate at a distant site (Fig. 2B).
The G8 invasion assay is relatively simple. Plate G8 myoblasts at a density of 2 × 10⁵ cells per well in 6-well dishes 3 days before the assay begins. This time in culture allows the myoblasts to deposit extracellular matrix proteins on the cell surface. When the cells reach confluence, wash the monolayer once with PBS and fix with dimethyl sulfoxide for 2h at room temperature, which results in a monolayer of both extracellular matrix protein and myoblast cells. After fixation, rinse the monolayer gently four times with PBS and incubate with 1 ml of culture medium.
Dissociate the cells to be evaluated with the enzyme-free dissociation medium as described earlier. Then collect the cell suspension by centrifugation to remove the dissociation medium, resuspend in growth medium, and count. Add a 1-ml suspension of the cells to the top of the G8 myoblast monolayer and observe daily. Invasion generally occurs within 1 to 3 days of seeding. The appropriate cell density and growth medium for each cell line used in this assay should be determined empirically. The percentage of fetal bovine serum used in the culture medium is a critical consideration; different cells require different amounts of FBS for the assay to be interpretable. In our experience with the MDA-MD-231, MCF-7, OVCA-420,-429, 432, 433, OVCAR-3, and -5 human tumor cell lines, a good starting point for the optimization of this assay is a cell density of 5 × 10³ cells per well in growth medium supplemented with 1% FBS. The ability of cells to invade and degrade the myoblast monolayer and begin to proliferate can be visualized using an inverted phasecontrast microscope. A good positive control for this assay is the OVCA-432 cell line, and a good negative control is the NIH 3T3 cell line.
The two-dimensional Matrigel assay provides a qualitative assay that correlates well with in vivo invasion and metatasis (Petersen et al., 1992) (Fig. 2C). Thaw Matrigel overnight on ice at 4°C. Matrigel will begin to solidify at temperatures above 4°C. Therefore, it is important to thaw the Matrigel slowly and not allow it to warm before it is aliquoted. Each 12-well dish should be placed on ice for 10 to 15 min in order to cool the dish to 4°C. After chilling each dish, add 700 µl of Martigel to each well. Transfer the Matrigelcoated dishes to 37°C and incubate for a minimum of 30 min. While the Matrigel is solidifying, dissociate the cells of interest with enzyme-free cell dissociation medium. Spin the cells out of the dissociation medium and plate 2 × 10⁵ per well in 1 ml of growth media. The ability of the cells to invade the Matrigel and organize into honeycomb-like structures can be assessed 24h after incubation using an inverted phase-contrast microscope. A good positive control for this assay is the highly invasive MDA-MB-468 cell line, and a good negative control is the noninvasive MCF-7 cell line (Eckert et al. 2004).
References
Albini, A., Iwamoto, Y., Kleinman, H. K., Martin, G. R., Aaronson, S. A., Kozlowski, J. M., and McEwan, R. N. (1987). A rapid in vitro assay for quantitating the invasive potential of tumor cells. Cancer Res. 47, 3239-3245.
Booden, M. A., Campbell, S. L., and Der, C. J. (2002). Critical but distinct roles for the pleckstrin homology and cysteine-rich domains as positive modulators of Vav2 signaling and transformation. Mol. Cell. Biol. 22, 2487-2497.
Clark, E. A., Golub, T. R., Lander, E. S., and Hynes, R. O. (2000). Genomic analysis of metastasis reveals an essential role for RhoC. Nature 406, 532-535.
Clark, G. J., Cox, A. D., Graham, S. M., and Der, C. J. (1995). Biological assays for Ras transformation. Methods Enzymol. 255, 395-412.
Eckert, L. B., Repasky, G. A., Olk6, A. S., McFall, A., Zhou, H., Sartor, C. I., and Der, C. J. (2004). Involvement of Ras activation in human breast cancer cell signaling, invasion, and anoikis. Cancer Res. 64, 4585-4592.
Fabian, J. R., Daar, I. O., and Morrison, D. K. (1993). Critical tyrosine residues regulate the enzymatic and biological activity of Raf-1 kinase. Mol. Cell. Biol. 13, 7170-7179.
Hanahan, D., and Weinberg, R. A. (2000). The hallmarks of cancer. Cell 100, 57-70.
Keely, P. J., Westwick, J. K., Whitehead, I. P., Der, C. J., and Parise, L. V. (1997). Cdc42 and Racl induce integrin-mediated cell motility and invasiveness through PI(3)K. Nature 390, 632-636.
Khosravi-Far, R., Solski, P. A., Kinch, M. S., Burridge, K., and Der, C. J. (1995). Activation of Rac and Rho, and mitogen activated protein kinases, are required for Ras transformation. Mol. Cell. Biol. 15, 6443-6453.
Martin, C. B., Mahon, G. M., Klinger, M. B., Kay, R. J., Symons, M., Der, C. J., and Whitehead, I. P. (2001). The thrombin receptor, PAR-l, causes transformation by activation of Rho-mediated signaling pathways. Oncogene 20, 1953-1963.
Qiu, R.-G., Chen, J., Kirn, D., McCormick, E, and Symons, M. (1995). An essential role for Rac in Ras transformation. Nature 374, 457-459.
Sahai, E., and Marshall, C. J. (2002). RHO-GTPases and cancer. Nature Rev. Cancer 2, 133-142.
Schmidt, A., and Hall, A. (2002). Guanine nucleotide exchange factors for Rho GTPases: Turning on the switch. Genes Dev. 16, 1587-1609.
Solski, P. A., and Der, C. J. (2000). Analyses of transforming activity of Rho family activators. Methods Enzymol. 325, 425-441.
Whitehead, I. P., Zohn, I. E., and Der, C. J. (2001). Rho GTPasedependent transformation by G protein-coupled receptors. Oncogene 20, 1547-1555.
Yu, Q., and Stamenkovic, I. (1999). Localization of matrix metalloproteinase 9 to the cell surface provides a mechanism for CD44- mediated tumor invasion. Genes Dev. 13, 35-48.
Yu, Q., Toole, B. P., and Stamenkovic, I. (1997). Induction of apoptosis of metastatic mammary carcinoma cells in vivo by disruption of tumor cell surface CD44 function. J. Exp. Med. 186, 1985-1996.
Support our developers


