Enzymes
Thus, if we homogenize a tissue in a solution that retains the enzyme in its soluble state, the enzyme can be subsequently separated from all insoluble proteins by centrifugation or filtration. The enzyme will be impure, since it will be in solution with many other proteins. If aliquots of a concentrated ammonium sulfate solution are added serially, individual proteins will begin to precipitate according to their solubility. By careful manipulation of the salt concentrations, we can produce fractions that contain purer solutions of enzymes, or at least are enriched for a given enzyme. Fortunately, absolute purity of an enzyme extract is seldom required, but when it is, the fractions must be subjected to further procedures designed for purification (such as electrophoresis and/or column chromatography).
In order to determine the effectiveness of the purification, each step in the extraction procedure must be monitored for enzyme activity. That monitoring can be accomplished in many ways, but usually involves a measurement of the decrease in substrate, or the increase in product specific to the enzyme. It is important to remember that enzymes act as catalysts to a reaction and that they affect only the reaction rate. The general formula for the action of an enzyme is expressed by the following:
where,
E = concentration of the enzyme
S and P = concentrations of substrate and product, respectively
ES and EP = concentration of enzyme-substrate complex and enzyme product complex
k1–k4 = rate constants for each step
From equation 4.1, the rates (velocities) of each reaction can be expressed as:
ν1 = k1 (E) (S); formation of enzyme-substrate complex
ν2 = k2 (ES); reformation of free enzyme and substrate
ν3 = k3 (ES); formation of product and free enzyme
ν4 = k4 (E) (P); reformation of enzyme-product complex
In steady state equilibrium, (v1 – v2) = (v3 – v4) and, if all product is either removed or does not recombine with the enzyme, then k4 = 0, and k1(E)(S) – k2(ES) = k3(ES).
This equation can then be rearranged to yield:
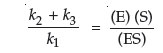
where the left side of this equation can be expressed as a single constant, known as Km, the rate constant, or the Michaelis constant. Note that the units for this constant will be those of concentration.
One of the important concepts of metabolism is that enzymes from differing sources may have the same function (i.e., the same substrate and product), but possess significantly different Km values. Since biological function is as dependent on the rate of a reaction as it is on the direction of a reaction, it becomes necessary to measure the Km value for any enzyme studied.
Enzymes act as catalysts because of their 3-dimensional protein structure. This structure is controlled by many factors, but is particularly sensitive to changes in pH, salts, and temperature. Small changes in the temperature of a reaction can significantly alter the reaction rate, and extremely high temperatures can irreversibly alter both the 3-dimensional structure of the enzyme and its activity. It may even render the enzyme nonfunctional; that is, denature the enzyme. Salts can also cause denaturation, but the effects of ammonium sulfate are usually reversible. Heavy metal salts, by contrast, usually irreversibly alter the structure of the protein, and thus their routine use as fixatives in histological work.
Active Sites
An enzyme works by binding to a given substrate in such a geometrical fashion that the substrate is able to undergo its inherent reaction at a rapid rate. This type of reaction is commonly referred to as the lock and key model for enzyme action. It implies that there is a particular part of the enzyme structure, the active site, which specifically binds sterically to a substrate. The enzyme does not actually react with the substrate, but merely brings the substrate into the proper alignment or configuration for it to react spontaneously or in conjunction with another substance. Since a reaction proceeds normally by a random kinetic action of molecules bumping into each other, any time molecules are aligned, they will react faster. Thus, for any given enzyme, there will be a best fit configuration to the protein in order to align the substrate and facilitate the reaction. When the enzyme is in its ideal configuration, the reaction will proceed at its maximum rate, and the overall rate of activity will be dependent upon substrate concentration.
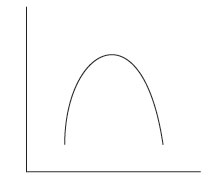 |
FIGURE 1 For effect of pH and temperature. |
Maximum reaction rate assumes that an optimal pH, salt, environment, and temperature have been established. Figure 1 demonstrates some typical effects of temperature and pH on the rate of an enzyme-catalyzed reaction. Maximum rate further assumes the presence of any coenzymes and/or cofactors that the enzyme requires. Coenzymes are organic molecules that must bind to the protein portion of the enzyme in order to form the correct configuration for a reaction. Cofactors are inorganic molecules, which do the same.
Now, if we measure the concentration of an enzyme via its rate of activity (i.e., the velocity of the catalyzed reaction), we must control the reaction for the effects of temperature, pH, salt concentration, coenzymes, cofactors, and substrate concentration. Each of these parameters affects the rate of an enzyme reaction. Thus, each must be carefully controlled if we attempt to study the effects of changes in the enzyme itself. For example, alterations in the rate of a reaction are directly dependent upon the concentration of functional enzyme molecules only when the enzyme is the limiting factor in the reaction. There must be sufficient substrate to saturate all enzyme molecules in order for this criterion to be met. If the substrate concentration is lowered to the point where it becomes rate-limiting, it is impossible to accurately measure the enzyme concentration, because there will be 2 variables at work.
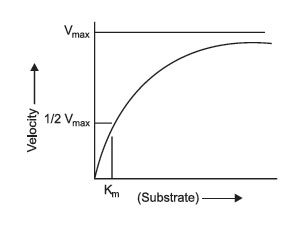 |
FIGURE 2 Michaelis-Menten plots. |
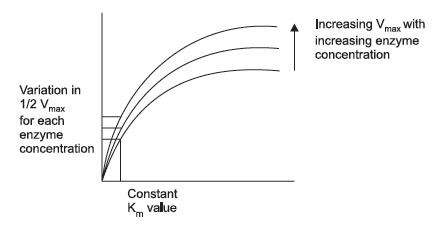 |
FIGURE 3 Effect of increasing enzyme concentration. |
The relationship between substrate concentration and enzyme concentration was mathematically established by pioneering work of 2 biochemists, L. Michaelis and M.L. Menten, in 1913. In recognition of their work, the plots of enzyme activity versus substrate concentration are known as Michaelis-Menten plots (Figure 2). These are relatively simple plots in which the substrate concentration is on the x-axis, and the velocity of reaction is on the y-axis. The plot demonstrates that as the substrate increases, the velocity increases hyperbolically, and approaches a maximum rate known as Vmax. This is dependent upon saturation of the enzyme. At Vmax, all enzyme molecules are complexed with substrate, and thus, any additional substrate added to the reaction has no effect on the rate of reaction.
However, this situation becomes more complex: as you change the enzyme concentration, Vmax will also change. Thus, Vmax is not a constant value, but is constant only for a given enzyme concentration. Consequently, the value of Vmax cannot be used directly to infer enzyme concentration. It is dependent upon at least 2 variables, enzyme concentration and substrate concentration (assuming temperature, pH, and cofactors have all been controlled). What Michaelis and Menten discovered was a simple means of solving the equations for two variables. If multiple plots of enzyme activity versus substrate concentration are made with increasing enzyme concentration, the value of Vmax continues to increase, but the substrate concentration that corresponds to one half Vmax remains constant. This concentration is the Michaelis constant for an enzyme. As mentioned, it is designated as Km and is operationally the concentration of substrate that will yield exactly 1/2 Vmax when it reacts with an enzyme with maximum pH, temperature, and cofactors.
According to the Michaelis-Menten equation: br>
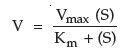
This equation is derived from the formula for a hyperbola (c = xy), where Km = (S) (Vmax/v – 1)
When v =Vmax/2, Km = (S) (Vmax/(Vmax/2) – 1) = (S), confirming that the units of this constant are those of concentration.
A Michaelis-Menten plot can give us an easy way to measure the rate constant for a given enzyme. An immediate difficulty is apparent, however, when Michaelis-Menten plots are used. Vmax is an asymptote. Its value can only be certain if the reaction is run at an infinite concentration of substrate. Obviously, this is an impossible prospect in a lab.
In 1934, two individuals, Lineweaver and Burk made a simple mathematical alteration in the process by plotting a double inverse of substrate concentration and reaction rate (velocity).
The Lineweaver-Burk equation is:
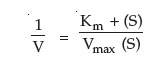
This equation fits the general form of a straight line, y = mx+b, where m is the slope of the line and b is the intercept. Thus, the Lineweaver-Burk Plot (Figure 4) for an enzyme is more useful than Michaelis-Menten plot, since as velocity reaches infinity, 1/Vmax approaches 0. Moreover, since the plot results in a straight line, the slope is equal to Km/Vmax, the y-intercept equals 1/Vmax (1/S = 0). Projection of the line back through the x-axis yields the value –1/Km (when 1/V = 0). These values can easily be determined by using a linear regression plot and calculating the corresponding values for x = 0 and y = 0. The inverse of the intercept values will then yield Vmax and Km.
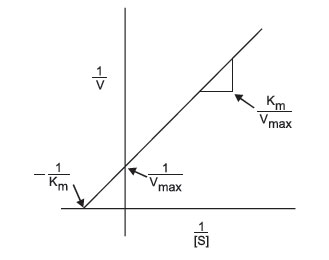 |
FIGURE 4 Lineweaver-Burk plot of enzyme activity.: |
Remember that the point of all of these calculations is to determine the true activity and, thus, the concentration of the enzyme. If the reaction conditions are adjusted so that the substrate concentration is at Km then alterations in the rate of reaction are linear and due to alterations in enzyme concentration. Kinetic analysis is the only means of accurately determining the concentration of active enzyme.
Specific Activity
This brings us to a definition for enzyme activity. “Specific activity” is defined in terms of enzyme units per mg enzyme protein. An enzyme unit is the amount of substrate converted to product per unit time under specific reaction conditions for pH and temperature.
As generally accepted, an enzyme unit is defined as that which catalyzes the transformation of 1 micromole of substrate per minute at 30°C and optimal chemical environment (pH and substrate concentration). Specific activity relates the enzyme units to the amount of protein in the sample.
While it is relatively easy to measure the protein content of a cell fraction, there may be a variable relationship between the protein content and a specific enzyme function. Remember that the initial extraction of an enzyme is accomplished by differential salt precipitation. Many proteins will precipitate together due to their solubility, but have no other common characteristics.
To determine both protein content and enzyme activity requires 2 different procedures. We can measure the amount of protein, or we can kinetically measure the enzyme activity. Combining the 2 will give us the specific activity.
Enzyme Inhibition
Finally, before studying a specific enzyme, let’s examine the problem of enzyme inhibition. Remember that enzymes function by sterically binding to a substrate. If a molecule interferes with that binding, it will hinder or inhibit the activity of the enzyme.
If the inhibitor molecule binds to the same active site as the substrate, then the reaction is known as “competitive inhibition” because the 2 molecules, substrate and inhibitor, compete for the same reaction site on the enzyme molecule. With this type of inhibition, Vmax will not change because Vmax is a function of all enzyme molecules uniting with substrate (thus having no effective competition). Km, on the other hand, will alter with changes in the concentration of a competitive inhibitor, because it requires larger concentrations of substrate to overcome the direct competition of the inhibitor for the active site.
If however, the inhibitor binds to a site on the enzyme other than the active site, then the inhibition is known as allosteric, or noncompetitive inhibition. In this instance, the substrate and inhibitor bind to different parts of the enzyme molecule and, thus, are not in competition. An allosteric inhibitor alters the structure of the enzyme or physically blocks access to the active site. With noncompetitive inhibition, Vmax will change because, in effect, enzyme is being removed from the reaction. Its kinetic effects are equivalent to lowering the enzyme concentration. Km will not change, however, since this value is constant regardless of the effective enzyme concentration.
Finally, there is a third class of inhibitor, which can best be defined by its effect on Vmax and Km. Known as uncompetitive, it alters both of these values. It has effects on both the active site and allosteric sites.
Tyrosinase
This exercise involves the isolation (extraction) of the enzyme tyrosinase from potatoes and subsequent measurement of its activity. Tyrosinase is the common name for an enzyme that is formally termed monophenol monooxygenase and is listed as Enzyme number 1.14.18.1 in the standard enzyme nomenclature. It is also known as phenolase, monophenol oxidase, and cresolase. It is, functionally, an oxygen oxidoreductase enzyme.
This nomenclature points out another difficulty of working with enzymes. Their names are derived from known activities. Enzymes isolated from different sources and measured for their catalytic activity with varying substrates, can turn out to be the same protein. Thus, the enzyme tyrosinase, discovered in animal systems, was named for its action on the amino acid tyrosine, and specifically for its ability to form dopaquinone, an intermediate metabolite in the production of melanin.
The same enzyme isolated from plant materials had been examined for its ability to oxidize phenolic residues, and thus the names phenolase, monophenol oxidase, and cresolase. Since it has been extensively studied in melanin production, we will continue to use the common name of tyrosinase.
The enzyme tyrosinase is fairly ubiquitous; that is, it is found in nearly all cells. In research, it has been purified from the fungus N. crassa by freezing kilogram quantities of the fungal mycelia in liquid nitrogen, homogenizing the frozen tissue with a French press, precipitating the proteins in ammonium sulfate, and purifying the enzyme chromatographically on Sephadex and Celite columns, a fairly complex undertaking.
Tyrosinase has been extracted from hamster melanomas by modifications of this technique and with the addition of acetone extractions, as well as DEAEcellulose chromatography and alumina treatments. Tyrosinase has also been separated from many plant tissues utilizing a far simpler technique based principally on ammonium sulfate precipitation of proteins.
The catalytic action of this enzyme is the conversion of tyrosine + O2 to yield dihydroxyphenylalanine (DOPA), which is then converted to dopaquinone + H2O. Dopaquinone, in turn, can be readily converted to dopachrome, an orange-to-red pigment (found in human red hair), which can then be converted to the black/brown melanin pigments (found in virtually all human pigments).
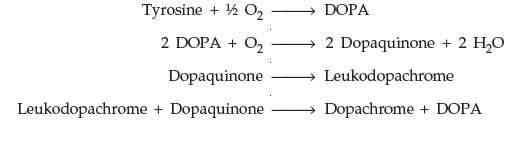
The enzyme catalyzes the first 2 of these reactions, namely the conversion of tyrosine and the conversion of DOPA. The formation of dopachrome from dopaquinone is spontaneous.
We can now monitor the activity of the enzyme by analyzing the disappearance of tyrosine and/or DOPA as substrates, the appearance of leukodopachrome or dopachrome as products, or by monitoring the use of oxygen.
Physiologists and chemists have long preferred the manometric determination of gaseous oxygen exchange, but far simpler is the determination of dopachrome, a natural pigment with an absorbance maximum of 475 nm. This absorbance allows us to use standard spectrophotometric analysis by analyzing the formation rate of dopachrome from the substrate DOPA.
The summary reaction for tyrosinase activity is DOPA + ½ O2 → Dopachrome
Support our developers


