Preparation of Standard Curve
- 8 mM DOPA
- Enzyme extract
- 5-mL pipette
- 0.1 M citrate buffer, pH 4.8
- Spectrophotometer and cuvettes
Procedure
- Begin by preparing a standard solution of the orange dopachrome from LDOPA. Add 0.5 mL of your enzyme extract to 10 mL of 8 mM DOPA and allow the solution to sit for 15 minutes at room temperature. During this period, all of the DOPA will be converted to dopachrome, and your solution will now contain 8 mM dopachrome. Dopachrome is somewhat unstable in the presence of light and should be stored in an amber bottle or out of the light.
- Prepare a 1:1 series of dilutions of the 8 mM dopachrome to yield the concentrations in the following table: add 3.0 mL of each indicated concentration to tubes 1–8.
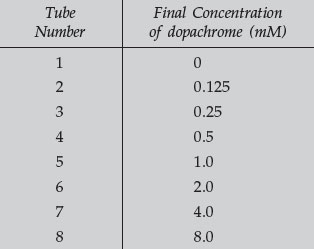
- With these dilutions, you have prepared tubes containing concentrations from 0 to 8 mM dopachrome (tubes 1–8). Tube 1 contains no dopachrome and is used for blanking the spectrophotometer.
- The units of concentration are millimolar (mM). A 1.0-mM solution contains .001 moles per liter or .000001 moles per mL. Thus, with a volume of 88 3.0 mL, there are .000003 moles of dopachrome, or 3 micromoles. Correspondingly, tubes 2–8 contain 1 to 24 micromoles of dopachrome. For the remainder of this exercise, be sure to distinguish between concentration (mM) and total amount of substance present (micromoles).
- Turn on your spectrophotometer and set the wavelength to 475. Use tube number 1 from the above dilutions as a blank and adjust the spectrophotometer for 0 and 100% T. Read the absorbance (or read and convert transmittance) of each of the solutions in tubes 2–8 and complete the following table:
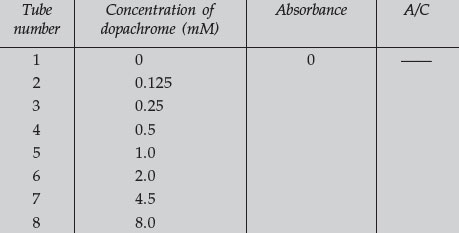
- Calculate the values for the last column of the table. This column represents the simplest calculation of the extinction coefficient for dopachrome absorbance. Average the values in this column and enter the number at the bottom of the column. This is the average extinction coefficient and can be used in subsequent determinations of dopachrome concentrations, according to the Beer-Lambert law. You can more accurately determine the extinction coefficient by performing a linear regression analysis of your data, and computing the slope and y-intercept. The slope of the linear regression will represent the extinction coefficient for your sample.
- Plot a scattergram of the absorbance value against the concentration of dopachrome. The known concentration of dopachrome should be the x-axis, while absorbance should be the y-axis.
- Plot the computed slope and intercept of the linear regression as a straight line overlaying your scattergram. The equation for a straight line is y = mx + b, where m is the slope and b the intercept.
Notes
Since tyrosinase catalyzes the conversion of L-DOPA to dopachrome, this exercise measures the conversion of colorless DOPA to the dark orange dopachrome. Substrate and product are in a 1:1 ratio for this reaction, thus the amount of product formed equals the amount of substrate used. The optical density of dopachrome at 475 nm is directly proportional to the intensity of orange formation in solution (Beer-Lambert Law).
Support our developers


