How Do Sterols Regulate Gene Expression?
Cholesterol regulates its own formation by inhibiting the transcription of several genes in the cholesterol pathway, most notably HMG-CoA synthase and HMG-CoA reductase. For many years it was also known that polyunsaturated fats decrease the level of cholesterol synthesis. Now we know how these regulatory events occur.The transcription of the cholesterol-regulated genes is regulated by a regulatory region that is upstream (before the transcriptional start site) of these genes.AspecialDNA sequence termed sterol responsive element (SRE) determines the responsiveness of these genes to regulation by cholesterol. How does cholesterol inhibit the transcription of genes with SREs?
Atranscription factor that binds to SREs is termed sterol regulatory element binding protein (SREBP). This protein turns on the transcription of genes with SREs in front of them, thus is a positive transcription factor.
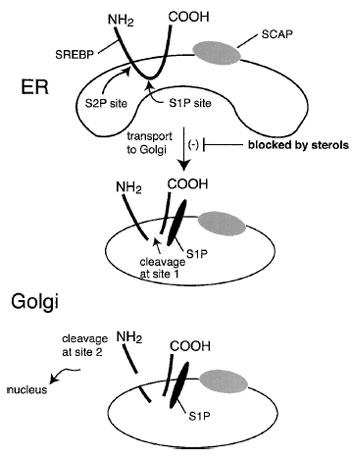
SREBP is found in the nuclear and endoplasmic reticulum membrane in an inactive form. To be activated, it must be cleaved from the membrane and released so that it can enter the nucleus and turn on transcription. The key to cholesterol regulation is that cholesterol (or more likely, a metabolite of cholesterol) inhibits this cleavage event. The “sensing” of cholesterol is carried out by another protein, sterol cleavage activated protein (SCAP), a protein that binds to SREBP. In sterol-depleted cells, SCAP escorts SREBP from the ER to the Golgi, where it is activated by proteolytic cleavage. This transport step is blocked by sterols. Interestingly, unsaturated fatty acids also inhibit SREBP activation, thus explaining how they inhibit cholesterol synthesis (Fig. 11).
 |
| Figure 11 Transcriptional regulation of sterol-responsive genes. A transcription factor termed sterol regulatory element binding protein (SREBP) binds to the SREs and enhances transcription. However, the SREBP is held captive bound to the endoplasmic reticulum membrane. Only when it is released by proteolytic cleavage does it travel to the nucleus, where it regulates sterol-responsive genes. The protein traverses the membrane twice and is cleaved by the successive actions of two proteases. The proteolysis step occurs in the Golgi. Transport of SREBP to the Golgi requires a second protein, SCAP. The transport step is inhibited by cholesterol through a sterol-sensing function of SCAP. Thus, cholesterol regulates gene expression by controlling the activation of a membrane-bound transcription factor, SREBP. |
The LDL receptor is also regulated by an SRE. This explains why cholesterol downregulates the activity of the LDL receptor. Many genes in fatty acid and triglyceride synthesis are regulated by SREs. The list is growing; thus the importance of SREBP in physiology will be enlarged in the future.
The expression of SREBP is enhanced by insulin. This helps to understand how insulin promotes lipogenesis through through global activation of expression of numerous lipogenic enzymes. In some individuals on high carbohydrate diets, plasma VLDL levels rise, a consequence of an abnormally high rate of de novo lipogenesis. The hyperinsulinemia that accompanies insulin resistance (see Section XVI) is also associated with increased levels of VLDL. This might be a consequence of insulin-mediated stimulation of SREBP expression.
Patients lacking the LDL receptor do not accumulate chylomicron remnants in the bloodstream. Since chylomicron remnant clearance is mediated by apo-E, it has been postulated that a separate receptor is responsible for chylomicron remnant clearance, a receptor that, in contrast to the LDL receptor, binds to apo-E, but not to apo-B100. Several additional members of the LDL receptor family have been identified (Table V). The first of these, the LRP, participates in chylomicron remnant clearance and plays a major role in that process when the LDL receptor is absent or dysfunctional.
TABLE III Properties of the Apolipoproteins
| Apolipoprotein | Molecular weight (Da) | Concentration (mg/dl) | Tissue origin | Function |
|---|---|---|---|---|
| Apo-A1 | 28,300 | 90–130 | Intestine, liver | LCAT activator |
| Apo-A2 | 17,000 | 30–50 | Intestine, liver | Unknown |
| Apo-A4 | 46,000 | 10–30 | Intestine, liver | Unknown |
| Apo-B100 | 516,000 | 80–100 | Liver | Cholesterol, triglyceride transport, receptor recognition |
| Apo-B48 | 264,000 | — | Intestine | Triglyceride, cholesterol transport |
| Apo-C1 | 6,500 | 4–7 | Liver | LCAT activator |
| Apo-C2 | 8,800 | 3–8 | Liver | LPL activator |
| Apo-C3 | 8,750 | 8–15 | Liver | LPL inhibitor |
| Apo-D | 33,000 | 10 | Liver, intestine, pancreas, kidney, adrenals, brain | Unknown |
| Apo-E | 35,000 | 3–6 | Liver, macrophages, brain, Adrenal | Receptor recognition |
| CETP | 74,000 | — | Spleen, liver, small intestine, adrenal | Cholesterol ester transfer |
| Lp(a) | 400–700 | 0.4–80 | Liver, testes, brain | Unknown |


