Energy Flow
Energy Flow
Every organism in nature has an energy budget. Just as we each must partition our income for housing, food, utilities, taxes, and so on, each organism must obtain enough energy to meet its metabolic costs, to grow, and to reproduce.
Ecologists divide the budget into three main components: gross productivity, net productivity, and respiration. Gross productivity is like gross income; it is the total energy assimilated, analogous to your paycheck before deductions. When an animal eats, food passes through its gut and nutrients are absorbed. Most energy assimilated from these nutrients serves the animal’s metabolic demands, which include cellular metabolism and regulation of body heat in endotherms. The energy required for metabolic maintenance is respiration, which is deducted from gross productivity to arrive at net productivity, an animal’s take-home pay. Net productivity is energy stored by the animal in its tissues as biomass. This energy is available for growth, and also for reproduction, which is population growth.
The energy budget of an animal is expressed by a simple equation, in which gross and net productivity are represented by Pg and Pn, respectively, and respiration is R:
This equation is a way of stating the first law of thermodynamics in the context of ecology. Its important messages are that the energy budget of every animal is finite and may be limiting, and that energy is available for growth of individuals and populations only after maintenance is satisfied.
The second law of thermodynamics, which states that the total disorder or randomness of a system always increases, is important when we study energy transfers between trophic levels in food webs. Energy for maintenance, R, usually constitutes more than 90% of the assimilated energy (Pg) for animal consumers. More than 90% of the energy in an animal’s food is lost as heat, and less than 10% is stored as biomass. Each succeeding trophic level therefore contains only 10% of the energy in the next lower trophic level. Most ecosystems are thereby limited to five or fewer trophic levels.
Our ability to feed a growing human population is influenced profoundly by the second law of thermodynamics.Humans, who occupy a position at the end of the food chain, may eat the grain that fixes the sun’s energy; this very short chain represents an efficient use of potential energy. Humans also may eat beef from animals that eat grass that fixes the sun’s energy; the addition of a trophic level decreases available energy by a factor of 10. Ten times as much plant biomass is needed to feed humans as meat eaters as to feed humans as grain eaters. Consider a person who eats a bass that eats a sunfish that eats zooplankton that eats phytoplankton that fixes the sun’s energy. The tenfold loss of energy occurring at each trophic level in this five-step chain requires that the pond must produce 5 tons of phytoplankton for a person to gain a pound by eating bass. If the human population depended on bass for survival, we would quickly exhaust this resource.
These figures must be considered as we look to the sea for food. Productivity of oceans is very low and limited largely to estuaries, marshes, reefs, and upwellings where nutrients are available to phytoplankton producers. Such areas constitute a small part of the ocean. The rest is a watery void.
Marine fisheries supply 18% of the world’s protein, but much of this protein is used to feed livestock and poultry. If we remember the rule of 10-to-1 loss in energy with each transfer of material between trophic levels, then use of fish as food for livestock rather than humans is poor use of a valuable resource in a protein-deficient world. Fishes that we prefer to eat include flounder, tuna, and halibut, which are three or four levels up the food chain. Every 125 g of tuna requires one metric ton of phytoplankton to produce. If humans are to derive greater benefit from the oceans as a food source, we must eat more of the less desirable fishes that are at lower trophic levels.
When we examine the food chain
in terms of biomass at each level, we
can construct ecological pyramids either of numbers or of biomass. A
pyramid of numbers (Figure 40-14A),
also known as Eltonian pyramid (after Charles Elton, who first devised
the scheme), depicts numbers of organisms
that are transferred between each
trophic level. This pyramid provides a
vivid impression of the great difference
in numbers of organisms involved in
each step of the chain, and supports the
observation that large predatory animals
are rarer than the small animals on
which they feed. However, a pyramid
of numbers does not indicate actual
mass of organisms at each level.
More instructive are pyramids of biomass (Figure 40-14B), which depict the total bulk, or “standing crop,” of organisms at each trophic level. Such pyramids usually slope upward because mass and energy are lost at each transfer. However, in some aquatic ecosystems in which the producers are algae, which have short life spans and rapid turnover, the pyramid is inverted. Algae can tolerate heavy exploitation by the zooplankton consumers. Therefore, the base of the pyramid (biomass of phytoplankton) is smaller than the biomass of zooplankton it supports. We could liken this inverted pyramid to a person who weighs far more than the food in a refrigerator, but who can be sustained from the refrigerator because the food is constantly replenished.
A third type of pyramid is a pyramid of energy, which shows rate of energy flow between levels (Figure 40-14C). An energy pyramid is never inverted because energy transferred from each level is less than what was put into it. A pyramid of energy gives the best overall picture of community structure because it is based on production. In the example above, productivity of phytoplankton exceeds that of zooplankton, even though biomass of phytoplankton is less than biomass of zooplankton (because of heavy grazing by the zooplankton consumers).
Every organism in nature has an energy budget. Just as we each must partition our income for housing, food, utilities, taxes, and so on, each organism must obtain enough energy to meet its metabolic costs, to grow, and to reproduce.
Ecologists divide the budget into three main components: gross productivity, net productivity, and respiration. Gross productivity is like gross income; it is the total energy assimilated, analogous to your paycheck before deductions. When an animal eats, food passes through its gut and nutrients are absorbed. Most energy assimilated from these nutrients serves the animal’s metabolic demands, which include cellular metabolism and regulation of body heat in endotherms. The energy required for metabolic maintenance is respiration, which is deducted from gross productivity to arrive at net productivity, an animal’s take-home pay. Net productivity is energy stored by the animal in its tissues as biomass. This energy is available for growth, and also for reproduction, which is population growth.
The energy budget of an animal is expressed by a simple equation, in which gross and net productivity are represented by Pg and Pn, respectively, and respiration is R:
| Pn= Pg − R |
This equation is a way of stating the first law of thermodynamics in the context of ecology. Its important messages are that the energy budget of every animal is finite and may be limiting, and that energy is available for growth of individuals and populations only after maintenance is satisfied.
The second law of thermodynamics, which states that the total disorder or randomness of a system always increases, is important when we study energy transfers between trophic levels in food webs. Energy for maintenance, R, usually constitutes more than 90% of the assimilated energy (Pg) for animal consumers. More than 90% of the energy in an animal’s food is lost as heat, and less than 10% is stored as biomass. Each succeeding trophic level therefore contains only 10% of the energy in the next lower trophic level. Most ecosystems are thereby limited to five or fewer trophic levels.
Our ability to feed a growing human population is influenced profoundly by the second law of thermodynamics.Humans, who occupy a position at the end of the food chain, may eat the grain that fixes the sun’s energy; this very short chain represents an efficient use of potential energy. Humans also may eat beef from animals that eat grass that fixes the sun’s energy; the addition of a trophic level decreases available energy by a factor of 10. Ten times as much plant biomass is needed to feed humans as meat eaters as to feed humans as grain eaters. Consider a person who eats a bass that eats a sunfish that eats zooplankton that eats phytoplankton that fixes the sun’s energy. The tenfold loss of energy occurring at each trophic level in this five-step chain requires that the pond must produce 5 tons of phytoplankton for a person to gain a pound by eating bass. If the human population depended on bass for survival, we would quickly exhaust this resource.
These figures must be considered as we look to the sea for food. Productivity of oceans is very low and limited largely to estuaries, marshes, reefs, and upwellings where nutrients are available to phytoplankton producers. Such areas constitute a small part of the ocean. The rest is a watery void.
Marine fisheries supply 18% of the world’s protein, but much of this protein is used to feed livestock and poultry. If we remember the rule of 10-to-1 loss in energy with each transfer of material between trophic levels, then use of fish as food for livestock rather than humans is poor use of a valuable resource in a protein-deficient world. Fishes that we prefer to eat include flounder, tuna, and halibut, which are three or four levels up the food chain. Every 125 g of tuna requires one metric ton of phytoplankton to produce. If humans are to derive greater benefit from the oceans as a food source, we must eat more of the less desirable fishes that are at lower trophic levels.
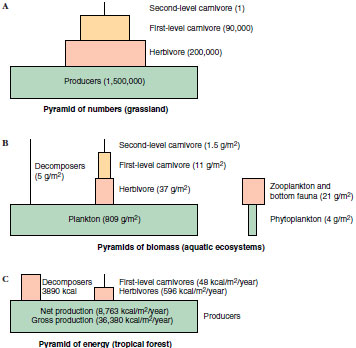 |
| Figure 40-14 Ecological pyramids of numbers, biomass, and energy. Pyramids are generalized, since the area within each trophic level is not scaled proportionally to quantitative differences in units given. |
More instructive are pyramids of biomass (Figure 40-14B), which depict the total bulk, or “standing crop,” of organisms at each trophic level. Such pyramids usually slope upward because mass and energy are lost at each transfer. However, in some aquatic ecosystems in which the producers are algae, which have short life spans and rapid turnover, the pyramid is inverted. Algae can tolerate heavy exploitation by the zooplankton consumers. Therefore, the base of the pyramid (biomass of phytoplankton) is smaller than the biomass of zooplankton it supports. We could liken this inverted pyramid to a person who weighs far more than the food in a refrigerator, but who can be sustained from the refrigerator because the food is constantly replenished.
A third type of pyramid is a pyramid of energy, which shows rate of energy flow between levels (Figure 40-14C). An energy pyramid is never inverted because energy transferred from each level is less than what was put into it. A pyramid of energy gives the best overall picture of community structure because it is based on production. In the example above, productivity of phytoplankton exceeds that of zooplankton, even though biomass of phytoplankton is less than biomass of zooplankton (because of heavy grazing by the zooplankton consumers).
Support our developers


