Population Growth and Intrinsic Regulation
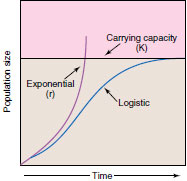 |
| Figure 40-4 Population growth, showing exponential growth of a species in an unlimited environment, and logistic growth in a limited nvironment. |
Population growth is the difference between rates of birth and death. As Darwin recognized from the essay of Thomas Malthus, all populations have the inherent ability to grow exponentially. This ability is called the intrinsic rate of increase, denoted by the symbol r. The steeply rising curve in Figure 40-4 shows this kind of growth. If species actually grew in this fashion unchecked, earth’s resources soon would be exhausted and mass extinction would follow. A bacterium dividing three times per hour could produce a colony a foot deep over the entire earth after a day and a half, and this mass would be over our heads only one hour later. Animals have much lower potential growth rates than bacteria, but could achieve the same kind of result over a longer period of time, given unlimited resources. Many insects lay thousands of eggs each year. A single codfish may spawn 6 million eggs in a season, and a field mouse can produce 17 litters of five to seven young each year. Obviously, unrestricted growth is not the rule in nature.
Even in the most benign environment, a growing population eventually exhausts food or space. Exponential increases such as locust outbreaks or planktonic blooms in lakes must end when food or space is expended. Actually, among all resources that could limit a population, the one in shortest supply relative to the needs of the population will be depleted before others. This one is termed the limiting resource. The largest population that can be supported by the limiting resource in a habitat is called the carrying capacity of that environment, symbolized K. Ideally, a population will slow its growth rate in response to diminishing resources until it just reaches K, as represented by the sigmoid curve in Figure 40-4. Sigmoid growth occurs when there is negative feedback between growth rate and population density. This phenomenon is called density dependence, and is the mechanism for intrinsic regulation of populations. We can compare density dependence by negative feedback to the way endothermic animals regulate their body temperatures when the environmental temperature exceeds an optimum. If the resource is expendable,as with food, carrying capacity is reached when the rate of resource replenishment equals the rate of depletion by the population; the population is then at K for that limiting resource. According to the logistic model, when population density reaches K, rates of birth and death are equal and growth of the population ceases. Thus, a population of grasshoppers in a green meadow may be at carrying capacity even though we see plenty of unconsumed food.
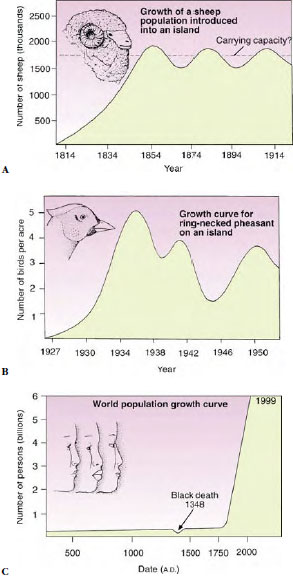 |
| Figure 40-5 Growth curves for sheep (A), ring- necked pheasant (B), and world human populations (C) throughout history. Note that the sheep population on an island is stable because of human control of the population, but the ring- necked pheasant population oscillates greatly, probably because of large changes in carrying capacity. Where would you place the carrying capacity for the human population? |
Although experimental populations of protozoa may fit the logistic growth curve closely, most populations in nature tend to fluctuate above and below carrying capacity. For example, after sheep were introduced to Tasmania around 1800, their numbers changed logistically with small oscillations around an average population size of about 1.7 million; we thereby infer the carrying capacity of the environment to be 1.7 million sheep (Figure 40-5A). Ring-necked pheasants introduced on an island in Ontario, Canada exhibited wider oscillations (Figure 40-5B).
Why do intrinsically regulated populations oscillate this way? First, the carrying capacity of an environment can change over time, requiring that a population change its density to track the limiting resource. Second, animals always experience a lag between the time that a resource becomes limited and the time that the population responds by reducing its rate of growth. Third, extrinsic factors occasionally may limit a population’s growth below carrying capacity. We consider extrinsic factors below.
On the global scale, humans have the longest record of exponential population growth (Figure 40-5C). Although famine and war have restrained growth of populations locally, the only dip in global human growth resulted from bubonic plague (“black death”), which decimated much of Europe during the fourteenth century. What then is the carrying capacity for the human population?The answer is far from simple, and several important factors must be considered when estimating the human K.
With the development of agriculture, the carrying capacity of the environment increased, and the human population grew steadily from 5 million around 8000 B.C., when agriculture was introduced, to 16 million around 4000 B.C. Despite the toll taken by terrible famines, disease, and war, the population reached 500 million by 1650. With the coming of the Industrial Revolution in Europe and England in the eighteenth century, followed by a medical revolution, discovery of new lands for colonization, and better agriculture practices, the human carrying capacity increased dramatically. The population doubled to 1 billion around 1850. It doubled again to 2 billion by 1927, to 4 billion in 1974, passed 6 billion in October 1999, and is expected to reach 8.9 billion by the year 2030. Thus, the growth has been exponential and remains high (Figure 40-5C).
Although rapid advancements in agricultural, industrial, and medical technology have undoubtedly increased the earth’s carrying capacity for humans, it also has widened the difference between birth and death rates to increase our rate of exponential growth. Each day we add 215,000 people (net) to the approximately 6 billion people currently alive. Assuming that growth remains constant (certainly not a safe assumption, based on the history of human population growth), by the year 2030 more than half a million people will be added each day. In other words, less than ten days will be required to replace all people who inhabited the world in 8000 B.C.
In trying to arrive at an estimate of carrying capacity for the human species, we must consider not only quantity of resources, but quality of life. Approximately 2 billion of the 6 billion people alive today are malnourished. At present 99% of our food comes from the land, and the tiny fraction that we derive from the sea is decreasing due to overexploitation of fish stocks. Although there is some disagreement on what would constitute the maximum sustainable agricultural output, scientists do not expect food production to keep pace with population growth.
Support our developers


