Interpreting the Fossil Record
 |
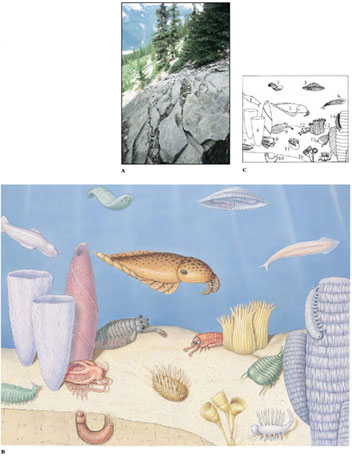
| Figure 6-9 A, Fossil trilobites visible at the Burgess Shale Quarry, British Columbia. B, Animals of the Cambrian period, approximately 580 million years ago, as reconstructed from fossils preserved in the Burgess Shale of British Columbia, Canada. The main new body plans that appeared rather abruptly at this time established the body plans of animals familiar to us today. C, Key to Burgess Shale drawing. Amiskwia (1), from an extinct phylum; Odontogriphus (2), from an extinct phylum; Eldonia (3), a possible echinoderm; Halichondrites (4), a sponge; Anomalocaris canadensis (5), from an extinct phylum; Pikaia (6), an early chordate; Canadia (7), a polychaete; Marrella splendens (8), a unique arthropod; Opabinia (9), from an extinct phylum; Ottoia (10), a priapulid; Wiwaxia (11), from an extinct phylum, Yohoia (12), a unique arthropod; Xianguangia (13), an anemone- like animal; Aysheaia (14), an onychophoran or extinct phylum; Sidneyia (15), a unique arthropod; Dinomischus (16), from an extinct phylum; Hallucigenia (17), from an extinct phylum. |
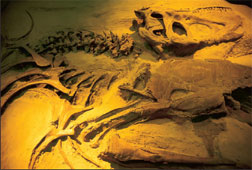
The fossil record is biased because preservation is selective. Vertebrate skeletal parts and invertebrates with shells and other hard structures left the best records (Figure 6-8). Soft-bodied animals, including the jellyfishes and most worms, are fossilized only under very unusual circumstances such as those that formed the Burgess Shale of British Columbia (Figure 6-9). Exceptionally favorable conditions for fossilization produced the Precambrian fossil bed of South Australia, the tar pits of Rancho La Brea (Hancock Park, Los Angeles), the great dinosaur beds (Alberta, Canada, and Jensen, Utah; Figure 6-10) and the Olduvai Gorge of Tanzania.
Fossils are deposited in stratified layers with new deposits forming on top of older ones. If left undisturbed, which is rare, a sequence is preserved with the ages of fossils being directly proportional to their depth in the stratified layers. Characteristic fossils often serve to identify particular layers. Certain widespread marine invertebrate fossils, including various foraminiferans and echinoderms, are such good indicators of specific geological periods that they are called “index,” or “guide,” fossils. Unfortunately, the layers are usually tilted or show faults (cracks). Old deposits exposed by erosion may be covered with new deposits in a different plane. When exposed to tremendous pressures or heat, stratified sedimentary rock metamorphoses into crystalline quartzite, slate, or marble, which destroys fossils.
Geological Time
Long before the earth’s age was known, geologists divided its history into a table of succeeding events based on the ordered layers of sedimentary rock. The “law of stratigraphy” produced a relative dating with the oldest layers at the bottom and the youngest at the top of the sequence. Time was divided into eons, eras, periods, and epochs. Time during the last eon (Phanerozoic) is expressed in eras (for example, Cenozoic), periods (for example, Tertiary), epochs (for example, Paleocene), and sometimes smaller divisions of an epoch.
In the late 1940s, radiometric dating methods were developed for determining the absolute age in years of rock formations. Several independent methods are now used, all based on the radioactive decay of naturally occurring elements into other elements. These “radioactive clocks” are independent of pressure and temperature changes and therefore are not affected by often violent earth-building activities.
 |
| Figure 6-10 A dinosaur skeleton partially excavated from rock at Dinosaur Provincial Park, Alberta. |
The fossil record of macroscopic organisms begins near the start of the Cambrian period of the Paleozoic era, approximately 600 million years BP. Geological time before the Cambrian is called the Precambrian era or Proterozoic eon. Although the Precambrian era occupies 85% of all geological time, it has received much less attention than later eras, partly because oil, which provides the commercial incentive for much geological work, seldom exists in Precambrian formations. The Precambrian era contains wellpreserved fossils of bacteria and algae, and casts of jellyfishes, sponge spicules, soft corals, segmented flatworms, and worm trails. Most, but not all, are microscopic fossils.
Evolutionary Trends
 |
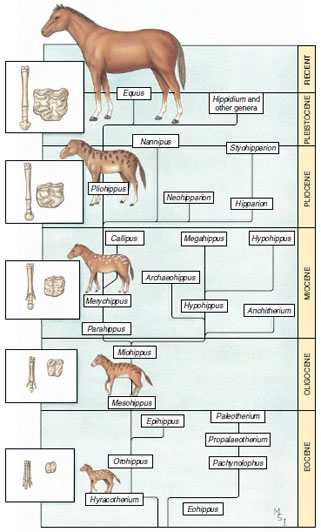
| Figure 6-11 A reconstruction of genera of horses from Eocene to present. Evolutionary trends toward increased size, elaboration of molars, and loss of toes are shown together with a hypothetical genealogy of extant and fossil genera. |
A well-studied fossil trend is the evolution of horses from the Eocene epoch to the present. Looking back at the Eocene epoch, we see many different genera and species of horses that were replaced by others through time (Figure 6-11). George Gaylord Simpson showed that this trend is compatible with Darwinian evolutionary theory. The three characteristics that show the clearest trends in horse evolution are body size, foot structure, and tooth structure. Compared to modern horses, the horses of extinct genera were small, their teeth had a relatively small grinding surface, and their feet had a relatively large number of toes (four). Throughout the subsequent Oligocene, Miocene, Pliocene, and Pleistocene epochs, there were continuing patterns of new genera arising and old ones going extinct. In each case, a net increase in body size, expansion of the grinding surface of the teeth, and reduction in the number of toes occurred. As the number of toes was reduced, the central digit became increasingly more prominent in the foot, and eventually only this central digit remained.
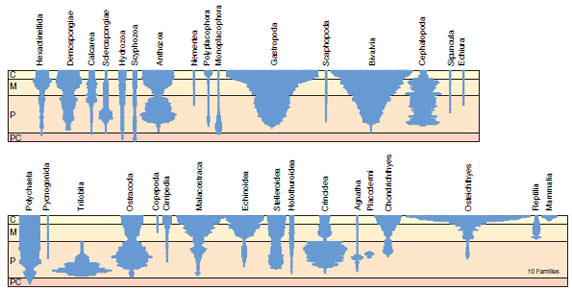
The fossil record shows a net change not only in the characteristics of horses but also variation in the numbers of different horse genera (and numbers of species) that have existed through time. The many horse genera of past epochs have been lost to extinction, leaving only a single survivor, Equus. Evolutionary trends in diversity are observed in fossils of many different groups of animals (Figure 6-12).
Trends in fossil diversity through time are produced by different rates of species formation versus extinction through time. Why do some lineages generate large numbers of new species whereas others generate relatively few? Why do different lineages undergo higher or lower rates of extinction (of species, genera, or taxonomic families) throughout evolutionary time? To answer these questions, we must turn to Darwin’s other four theories of evolution. Regardless of how we answer these questions, however, the observed trends in animal diversity clearly illustrate Darwin’s principle of perpetual change. Because the remaining four theories of Darwinism rely on the theory of perpetual change, evidence supporting these theories strengthens Darwin’s theory of perpetual change.
 |
| Figure 6-12 Diversity profiles of taxonomic families from different animal groups in the fossil record. The scale marks the Precambrian (PC), Paleozoic (P), Mesozoic (M), and Cenozoic (C) eras. The relative number of families is indicated from the width of the profile. |


