Chemometrics
Chemometrics has been defined as the chemical discipline that uses mathematical and statistical methods to design or select optimal measurement procedures and experiments and to provide maximum chemical information by analysing chemical data (Kowalski, 1978). It is a relatively new discipline that assists with (i) the planning of experiments, and (ii) the manipulation and interpretation of large data sets. Some aspects of chemometrics can be done using an appropriate speadsheet but the majority of applications require the use of dedicated software. The fundamental principles of most of the processes involved in chemometrics are those of statistics.When carrying out any experimental work, e.g. an undergraduate practical, you should always read the entire practical script before starting the experimentation. This is important as it allows you to plan each step of the process and to organize space and time to perform the experiment. This initial planning is further complicated in project work and research projects when, often, there is no laboratory script to follow. In these situations, you finally come down to planning the initial experiments after background research (e.g. reading'the appropriate scientific literature on the subject area to be investigated), purchasing/obtaining the appropriate chemicals/reagents, etc. (see also Box 10.1). It is at this stage that chemometrics can be of some assistance. Assuming that you are able to identify the dependent variables in the experiment, then you can apply 'experimental design' which allows you to gain the maximum amount of knowledge about the system you are investigating from fa limited number of experiments.
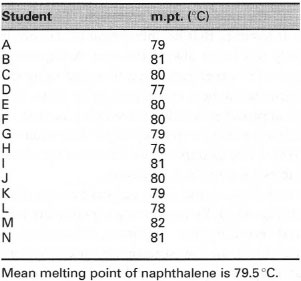 |
| Table 43.1 Melting points for naphthalene |
Once the experimental work has been completed you then need to consider how to interpret the results, i.e. how to maximize the chemical information inherent in the data. Initial attempts are often centred around plotting the data, to visualize trends and to allow conclusions to be drawn. The simplest form of data visualization is simply to tabulate the results. As an example, if a class of students has determined the melting point of naphthalene, it is a relatively simple matter to tabulate the data (see Table 43.1). One possibility for the data is then to calculate the mean and standard deviation. Another approach would be to plot the data as a histogram, as in Fig. 43.1, so we are then able to make a visual interpretation of the quality of this univariate (one-variable) data.
However, what if we had more than one variable to consider? In other words, we have multivariate data. For example, what if we want to identify trends in the properties of a range of organic molecules? The variables we might want to consider could be: melting point, boiling point, Mr, solubility in a solvent and vapour pressure. We can, of course, tabulate the data, as before, but this does not allow us to consider any trends in the data. To do this we need to be able to plot the data. However, once we exceed three variables (which we need to be able to plot in three dimensions) it becomes impossible to
 |
| Fig. 43.1 Histogram: melting point of naphthalene. |
The following discussion highlights only the basic principles. For more detailed information you are advised to consult the literature and dedicated chemometric software packages. It should always be borne in mind, however, that the choice of which variables to optimize should be selected (i) by someone with prior knowledge of the system/instrument under investigation, or (ii) after performing preliminary experiments to determine which are the most important variables.
Support our developers


