Describing the 'shape' of frequency distributions
Frequency distributions may differ in the following characteristics:- number of peaks;
- skewness or asymmetry;
- kurtosis or pointedness.
Genuinely bimodal or polymodal distributions may result from the combination of two or more unlimited distributions, indicating that more than one underlying population is being sampled (Fig. 40.5). An example of a bimodal distribution is the height of adult humans (females and males combined).
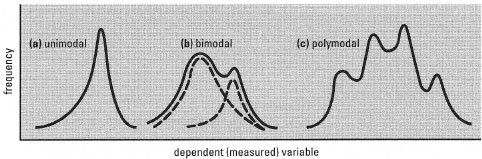 |
| Fig. 40.5 Frequency distributions with different numbers of peaks. A unimodal distribution (a) may be symmetrical or asymmetrical. The dashed lines in (b) indicate how a bimodal distribution could arise from a combination of two underlying unimodal distributions. Note here how the term 'bimodal' is applied to any distribution with two major peaks - their frequencies do not have to be exactly the same. |
A distribution is skewed if it is not symmetrical, a symptom being that the mean, median and mode are not equal (Fig. 40.3). Positive skewness is where the longer 'tail' of the distribution occurs for higher values of the measured variable; negative skewness where the longer tail occurs for lower values. Skewed distributions frequently occur in the study of chemical measurements, owing to the presence of occasional gross errors.
Kurtosis is the name given to the 'pointedness' of a frequency distribution. A platykurtic frequency distribution is one with a flattened peak, while aleptokurtic frequency distribution is one with a pointed peak (Fig. 40.6). While descriptive terms can be used, based on visual observation of the shape and direction of skew, the degree of skewness and kurtosis can be quantified and statistical tests exist to test the 'significance' of observed values, but the calculations required are complex and best done with the aid of a computer. >
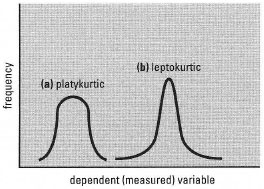 |
| Fig 40.6 Examples of the two types of kurtosis. |
Support our developers


