Measuring location
Here, the objective is to pinpoint the 'centre' of the frequency distribution, i.e. the value about which most of the data are grouped. The chief measures of location are the mean, median and mode.Mean
The mean (denoted Ÿ (Y bar) and also referred to as the arithmetic mean) is the average value of the data. It is obtained from the sum of all the individual data values divided by the number of data values (in symbolic terms, ∑ Y/n). The mean is a good measure of the centre of symmetrical frequency distributions of qualitative variables. It uses all of the numerical values of the sample and therefore incorporates all of the information content of the data. However, the value of a mean is greatly affected by the presence of outliers. The arithmetic mean is a widely used statistic in chemistry, but there are situations when you should be careful about using it (see Box 40.2 for examples).
Median
The median is the mid-point of the observations when ranked in increasing order. For odd-sized samples, the median is the middle observation; for evensized samples it is the mean of the middle pair of observations. For a quantitative variable, the median may represent the location of the main body of data better than the mean when the distribution is asymmetric or when there are outliers.
Mode
The mode is the most common value in the sample. The mode is easily found from a tabulated frequency distribution as the most frequent value. The mode provides a rapidly and easily found estimate of sample location and is unaffected by outliers. However, the mode is affected by chance variation in the shape of a sample's distribution and it may lie distant from the obvious centre of the distribution. Note that the mode is the only statistic to make sense of qualitative data, e.g. 'the modal (most frequent) technique used in the laboratory is infrared spectroscopy'. The mean, median and mode have the same units as the variable under discussion. However, whether these statistics of location have the same or similar values for a given frequency distribution depends on the symmetry and shape of the distribution. If it is near symmetrical with a single peak, all three will be very similar; if it is skewed or has more than one peak, their values will differ to a greater degree (see Fig. 40.3).
 |
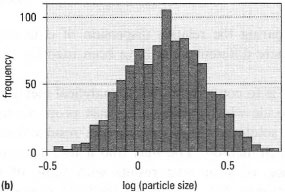 |
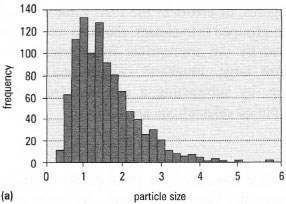
| Fig 40.4 (a) An approximately log-transformed distribution: particle size of droplets in flame spectroscopy. (b) The results in (a) plotted against the logarithm of particle size. |
Support our developers


