Presenting data in tables
A table is often the most appropriate way to present numerical data in a concise, accurate and structured form. Laboratory reports and project dissertations should contain tables which have been designed to condense and display results in a meaningful way and to aid numerical comparison.Decide whether you need a table, or whether a graph is more appropriate. Histograms and plotted curves can be used to give a visual impression of the relationships within your data. On the other hand, a table gives you the opportunity to make detailed numerical comparisons.
*Note: Always remember that the primary purpose of your table is to communicate information and allow appropriate comparison. not simply to put down the results on paper!
Preparation of tables
Title
Every table must have a brief descriptive title. If several tables are used, number them consecutively so they can be quoted in your text. The titles within a report should be compared with one another, making sure they are logical and consistent and that they describe accurately the numerical data contained within them.
Structure
Display the components of each table in a way that will help the reader understand your data and grasp the significance of your results. Organize the columns so that each category of like numbers or properties is listed vertically, while each horizontal row shows a different experimental treatment, element, sampling site, etc. (as in Table 38.1). Where appropriate, put control values near the beginning of the table. Columns that need to be compared should be set out alongside each other. If producing by hand, use rulings to sub-divide your table appropriately, but avoid cluttering it up with too many lines. Alternatively, for computer-generated tables, the use of boxes is more appropriate, to avoid confusion.
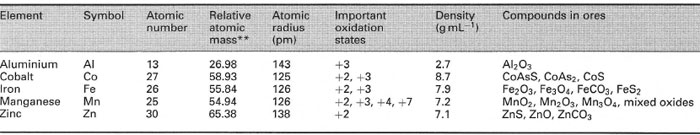 |
| Table 38.1 Selected properties of elements in the Periodic Table |
** Relative to the atomic mass of 12C(= 12).
Headings and sub-headings
These should identify each set of data and show the units of measurement, where necessary. Make sure that each column is wide enough for the headings and for the longest data value.
Numerical data
Within the table, do not quote values to more significant figures than necessary, as this will imply spurious accuracy. By careful choice of appropriate units for each column you should aim to present numerical data within the range 0 to 1000. As with graphs, it is less ambiguous to use derived SI units, with the appropriate prefixes, in the headings of columns and rows, rather than quoting multiplying factors as powers of 10. Alternatively, include exponents in the main body of the table (see Table 7.1), to avoid any possible confusion regarding the use of negative powers of 10.
Other notations
Avoid using dashes in numerical tables, as their meaning is unclear; enter a zero reading as '0' and use 'NT' for not tested or 'ND' if no data value was obtained, with a footnote to explain each abbreviation. Other footnotes, identified by asterisks, superscripts or other symbols in the table, may be used to provide relevant experimental detail (if not given in the text) and an explanation of column headings and individual results, where appropriate. Footnotes should be as condensed as possible. Table 38.1 provides an example.
Statistics
In tables where the dispersion of each data set is shown by an appropriate statistical parameter, you must state whether this is the (sample) standard deviation, the standard error (of the mean) or the 95% confidence limits and you must give the value of n (the number of replicates). Other descriptive statistics should be quoted with similar detail, and hypothesis-testing statistics should be quoted along with the value of P (the probability). Details of any test used should be given in the legend, or in a footnote.
Text
Sometimes a table can be a useful way of presenting textual information in a condensed form.
When you have finished compiling your tabulated data, carefully doublecheck each numerical entry against the original information, to ensure that the final version of your table is free from transcriptional errors. Box 38.1 gives a checklist for the major elements of constructing a table.
Support our developers


