1H-NMR spectra
These normally cover the range between δ = 0 and 10 ppm but the range is increased to δ = 15 ppm when acidic protons are present in the molecule. The 1H-NMR spectrum of a molecule gives three key pieces of information about the structure of a molecule:- Chemical shift (δ): the peak positions indicate the chemical (magnetic) environment of the protons, i.e. different protons in the molecule have different chemical shifts.
- Integration: the relative size of peak area indicates how many protons have the δ value shown.
- Coupling: the fine structure on each peak (coupling) indicates the number of protons on adjacent atoms.
- Prediction of the spectrum of the expected compound from theoretical knowledge and then comparison with the spectrum obtained. You should recognize 'patterns' (e.g. triplet and quartet for an ethyl group; a singlet of peak area six for two identical methyl groups), which were present in the starting materials, but the δH values may have changed in the 'new' molecule. There are computer programs, such as g-NMR®, which will simulate the NMR spectrum from a structural formula.
- Interpretation of the spectrum from correlation tables, but this is very difficult for the inexperienced.
*Note: Always make sure that your predicted structure is consistent with the spectrum.
Factors affecting chemical shift (δH)
The δ values of protons can be predicted to a general approximation from knowledge of the effects which produce variations in chemical shift.
- The hybridization of the carbon atom to which the hydrogen atom is
attached:
- Sp3 hybridized carbon: peaks occur between δ = 0.9 and 1.5 ppm in simple hydrocarbon systems. The peaks move. downfield with change of structure from CH3 to CH2 to CH.
- sp hybridized carbon: peaks occur at about δ = 1.5−3.5 ppm in alkynes.
- Sp2 hybridized carbon: in alkenes the resonances occur around δ =4−8 ppm and the C-H peaks of aromatic rings are found between b = 6 and 9 ppm. The large downfield shifts of these Csp2-H nuclei result from deshielding of the protons by fields set up by circulation of the n-electrons in the magnetic field. The proton of the aldehyde group (CHO) is particularly deshielded by this effect and is found at δ = 9−10 ppm.
- Electron attraction or electron release by substituent atoms attached to the carbon atom. Electron attracting atoms, such as N, O, Hal attached to the carbon, attract electron density from the C-H bonds and thus deshield the proton. This results in movement of the chemical shift to higher δ values (Table 29.1). Conversely, electron-releasing groups produce additional shielding of the C-H bonds resulting in upfield shifts of δ values.
- All the protons in benzene are identical and occur at δ = 7.27 ppm. In substituted aromatic compounds, the overall electron-attracting or releasing effect of the substituent(s) alters the δ values of the remaining ring protons making them non-equivalent. The ortho protons are affected most.
- For protons attached to atoms other than carbon: the chemical shifts of protons attached to oxygen increase with increasing acidity of the O-H group; thus δ = 1-6 ppm for alcohols, 4-12 ppm for phenols and 10-14 ppm for carboxylic acids. Hydrogens bound to nitrogen (l° and 2° amines) are found at δ = 3-8 ppm. The approximate chemical shift regions are shown in Fig. 29.5.
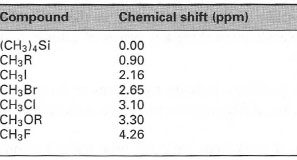 |
| Table 29. 1 Chemical shifts of methyl protons |
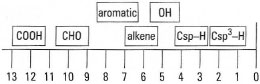 |
| Fig.29.5 Approximate chemical shift positions in the 1H-NMR spectrum. |
Integration of peak areas
The area of each peak gives the relative number of protons and is produced directly on the spectrum (Fig. 29.6). On CW-NMR spectrometers the height of the peak area integration line must be measured using a ruler, whereas on FT-NMR machines the area is calculated and displayed as a number. You must remember that:
- The areas are ratios, not absolute values, and you must find a peak attributable to a specific group to obtain a reference area, e.g. a single peak at δ = 1.0 ppm is likely to be a CH3 group and thus the area displayed or measured is equal to three protons.
- You must ensure that you include integrations from all the fine-structure (coupling) peaks in the peak area.
- Do not expect the peak area integrations to be exact whole numbers, e.g. an area of 2.8 is probably three protons (CH3), 5.1 is probably five protons (e.g. a C6H5 group), but 1.5 is probably a CH3 and all the peak area integrations must be doubled.
Coupling (spin-spin splitting)
Many 1H-NMR signals do not consist of a single line but are usually associated with several lines (splitting patterns). Protons giving multiline signals are said to be coupled. This coupling arises from the magnetic influence of protons on one atom with those on an adjacent atom(s). Thus information about the nature of adjacent protons can be determined and fed into the structural elucidation problem. To a simple first approximation the following three general points are useful in the interpretation of coupling patterns:
- Aliphatic systems: if adjacent carbon atoms have different types of
protons (a and b), then the protons will couple. If a proton is
coupled to n (n = 1, 2, 3, 4, 5, etc.) other protons on an adjacent
carbon atom, the number of lines observed is n + 1, as shown in the
examples below.
CH3CH2OCH3 Protons a are coupled to two protons b: n = 2; therefore the peak for protons a is split into three lines (a triplet).
Protons b are coupled to three protons a: n = 3; therefore the peak for protons b is split into four lines (a quartet).
Protons c have no adjacent protons and therefore are not coupled and give a single line (singlet) (Fig. 29.6).a b c
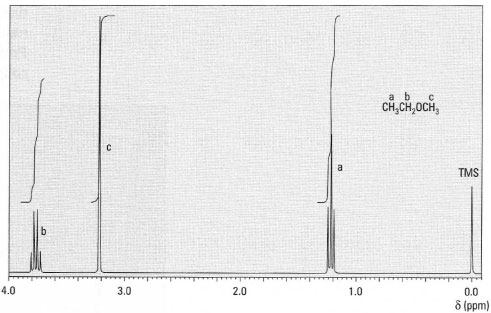
Fig. 29.6 1H-NMR spectrum of methoxyethane.
CH3CHBrCH2Br Protons a are coupled to one proton b: n = 1; therefore the peak for protons a is split into two lines (doublet)
Protons b are coupled to three protons a and two protons c: n = 5; therefore the peak for protons b is split into six lines (sextet).
Protons c are coupled to one proton b: n = 1; therefore the peak for protons c is split into two lines (doublet).
Protons a and protons c are not adjacent and do not couple (Fig. 29.7).a b c
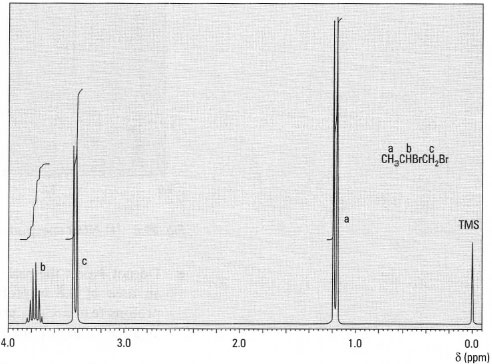
Fig.29.7 1H-NMR spectrum of 1,2-dibromopropane.
The intensity of each peak in the resulting singlet, doublet, triplet, quartet, etc., is calculated from Pascal's triangle (Fig. 29.8).
The separation between the coupled lines is called the coupling constant, J, and, for aliphatic protons CH, CH2 and CH3, it is usually ~ 8Hz.
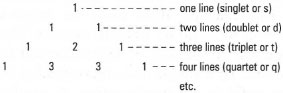
Fig. 29.8 Intensities of coupled peaks from
Pascal's triangle.
*Note: The (n + 1) rule only applies in systems where the coupling constant (J) between the protons is the same. Fortunately this is common in aliphatic systems. - Alkene hydrogens: hydrogen atoms on double bonds have different
coupling constants depending upon the stereochemistry of the alkene.
Alkene hydrogens in the Z (cis) configuration have J = 5-14Hz,
whereas those in the E (trans) configuration have J = 11-19 Hz (Figs
29.9a and b ).
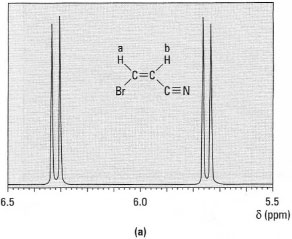
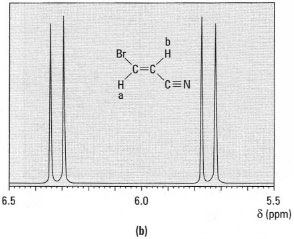
Fig.29.9 1H-NMR spectra of: (a) (Z)-3- bromopropanonitrile; (b) (E)-3-bromopropanonitrile.
- Aromatic hydrogens: coupling of hydrogens, which are non-adjacent, is
readily observed in aromatic compounds. Different protons ortho to each
other couple with J = 7-10 Hz, while those in a meta relationship have J = 2- 3 Hz. Para coupling (J = 0-1 Hz) is not usually seen on the
spectrum. The types of aromatic compound you are likely to meet most
often are:
- Monosubstituted aromatic compounds, in which three basic patterns are found in the aromatic region of the spectrum. If the substituent exerts a weak electronic effect on the ring, the δ values of the ring protons are similar and the protons appear as a single peak of area five (Fig. 29. l0a). If the group is strongly electron releasing (OH, NH2, OCH3, etc.), the protons appear as complex multiplets (ortho and meta coupled), below δ = 7.27 ppm of relative areas two to three (Fig. 29.10b). If the group is electron attracting (e.g. NO2, COOH, etc.), then the complex multiplets have δ > 7.27 ppm (Fig. 29.l0c);
- para disubstituted aromatic compounds, which are of two types. If the substituents are the same, then all the ring protons are identical and a singlet, of relative area four, is seen (Fig. 29.lOd). If the substituents are different, then the pairs of hydrogens ortho to each substituent are different and ortho-couple to give what appears to be pair of doublets, each of relative area two (Fig. 29.l0e).
- Increasing numbers of substituents, which decrease the number of
aromatic hydrogens and the spectrum becomes simpler. Thus the
common 1,2,4-trisubstituted pattern (Fig. 29.10f) is recognized easily
as an ortho-coupled doublet, a meta-coupled doublet and a doublet
of doublets (coupled ortho and meta).
The chemical shifts of aromatic protons can be calculated from detailed correlation tables.
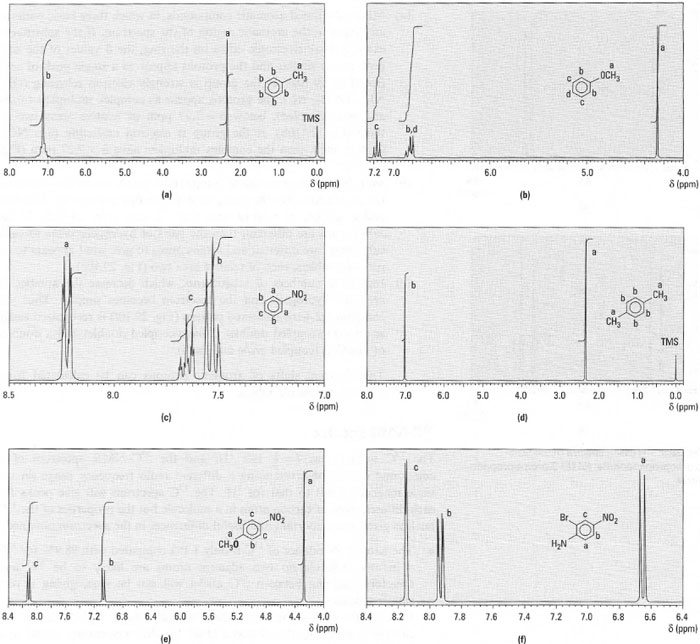 |
| Fig.29.10 1H-NMR spectra of (a) methyl benzene; (b) methoxybenzene; (c) nitrobenzene; (d) l,4-dimethylbenzene; (e) 4- methoxynitrobenzene; (f) 4-amino-3-bromonitrobenzene (NH2 protons not shown). |
Support our developers


