Cyclic voltammetry
The technique provides qualitative information about electrochemical reactions, e.g. the redox behaviour of compounds and the kinetics of electron transfer reactions. In practice, a triangular potential waveform is applied linearly to the working electrode in a unstirred solution. After a few seconds, the ramp is reversed and the potential is returned to its initial value. The process may be repeated several times. The resulting plot of current versus potential is termed a cyclic voltammogram. Fig. 34.9 shows a typical cyclic voltammogram for a reversible redox couple after a single potential cycle. It is assumed that the oxidized form, O, is the only species present at the start. Therefore, the first scan is towards the (more) negative direction, commencing at a value were no reduction occurs. As the applied potential approaches the characteristic E° for the redox process, a catholic current starts to increase, up to a maximum. After exceeding the potential at which the reduction process takes place, the direction of the potential current is reversed. During this stage, reduced molecules R, generated during the initial process, are reoxidized back to O, resulting in an anodic peak.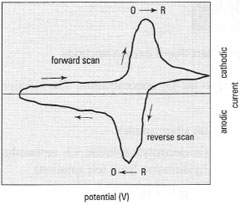 |
| Fig. 34.9 A typical cyclic voltammogram for a reversible O + ne− ↔ R redox process. |
Support our developers


