Nuclear magnetic resonance spectroscopy
Electromagnetic radiation (typically at radio frequencies of 60-600 MBz) is used to identify compounds in a process known as nuclear magnetic resonance (NMR) spectroscopy. This is possible because of differences in the magnetic states of atomic nuclei, involving very small transitions in energy levels. The atomic nuclei of the isotopes of many elements possess a magnetic moment. When these magnetic moments interact with a uniform external magnetic field, they behave like tiny compass needles and align themselves in a direction 'with' or 'against' the field. The two orientations, characteristic of nuclei with a nuclear spin quantum number I = ½, have two different energies: the orientation aligned 'with' the field has a lower energy than that aligned 'against' the field (Fig. 29.1).Typical magnetic nuclei of general use to chemists and biochemists are 1H, 13C, 19F and 31P, all of which have nuclear spin quantum numbers I = ½.The energy difference between the two levels (ΔE) corresponds to a precise electromagnetic frequency (ν), according to similar quantum principles for the excitation of electrons. When a sample containing an isotope with a magnetic nucleus is placed in a magnetic field and exposed to an appropriate radio frequency, transitions between the energy levels of magnetic nuclei will occur when the energy gap and applied frequency are in resonance (i.e. when they are matched exactly in energy). Differences in energy levels, and hence resonance frequencies (ν0), depend upon the magnitude of the applied magnetic field (B0) and the magnetogyric ratio (γ), according to the equation:
| ⇒ Equation [29.1] | ν0 = γB0/2π |
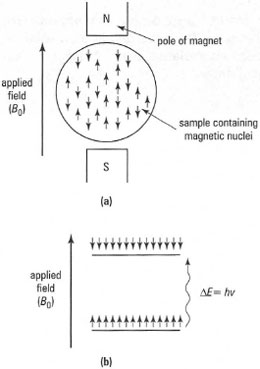 |
| Fig. 29.7 Effect of an applied magnetic field, Bo, on magnetic nuclei. (a) Nuclei in magnetic field have one of two orientations - either with the field or against the field (in the absence of an applied field, the nuclei would have random orientation). (b) Energy diagram for magnetic nuclei in applied magnetic field. |
For a given value of the applied field (B0), nuclei of different elements have different values of the magnetogyric ratio (γ) and will give rise to resonance at various radio frequencies. The principal components of an NMR spectrometer are shown in Fig. 29.2.
For magnetic nuclei in a given molecule, an NMR spectrum is generated because, in the presence of the applied field, different nuclei of the same atoms experience small, different, local magnetic fields depending on the arrangement of electrons, i.e. in the chemical bonds, in their vicinity. The effective field at the nucleus can be expressed as:
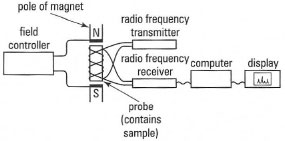 |
| Fig. 29.2 Components of an NMR spectrometer. |
| ⇒ Equation [29.2] | B = B0(1 − σ) |
where σ (the shielding constant) expresses the contribution of the small secondary field generated by the nearby electrons. The magnitude of σ depends on the electronic environment of a nucleus, so nuclei of the same isotope give rise to small different resonance frequencies according to the equation:
| ⇒ Equation [29.3] | ν0 = γB0(1 − σ)2π |
*Note: The variation of resonance frequencies with surrounding electron density is crucial to the usefulness of the NMR technique. If it did not occur, all nuclei of a single isotope would come into resonance at the same combination of magnetic field and radio frequency and only one peak would be observed in the spectrum.
Chemical shift
The separation of resonance frequencies resulting from the different electronic environments of the nucleus of the isotope is called the chemical shift. It is expressed in dimensionless terms, as parts per million (ppm) , against an internal standard, usually tetramethylsilane (TMS). By convention, the chemical shift is positive if the sample nucleus is less shielded (lower electron density in the surrounding bonds) than the nucleus in the reference and negative if it is more shielded (greater electron density in the surrounding bonds). The chemical shift scale (δ) for a nucleus is defined as:
| ⇒ Equation [29.4] | δ = [(νsample − νreference) × 106]/(νreference) |
This means that the chemical shift of a specific nucleus in a molecule is at the same δ value, no matter what the operating frequency of the NMR spectrometer.
An NMR spectrum is a plot of chemical shift (δ) as the x-axis against absorption of energy (resonance) as the y-axis. On the right-hand side of the spectrum at δ = 0 ppm there may be a small peak, which is the reference (TMS). A typical 1H-NMR spectrum is shown in Fig. 29.3.
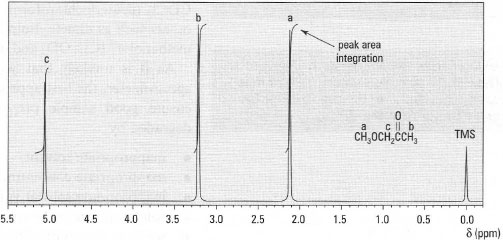 |
| Fig.29.3 1H-NMR spectrum of l-methoxypropanone. |
NMR spectrometers
These can operate at different radio frequencies and magnetic fields and are usually referred to in terms of radio frequency, e.g. 60 MHz, 270 MHz and 500 MHz spectrometers. Spectrometers operating above 100 MHz require expensive superconducting magnets to generate the high magnetic fields. In routine laboratory work 60 MHz and 90 MHz instruments are common but 270 MHz machines are becoming more affordable. Increasing the operating frequency of the spectrometer effectively increases the resolution of the chemical shifts of the nuclei under examination. For example, the difference in frequency between 0 and 1δ is 60 Hz in a 60 MHz spectrometer but 270 Hz for a 270 MHz instrument.
Spectrometers can be divided into two types:
- Continuous-wave (CW) spectrometers, which use a permanent magnet or an electromagnet, usually operating at 60 or 90 MHz. In practice the radio frequency is held constant and small electromagnets on the faces of the main magnet (sweep coils) vary the magnetic field over the chemical shift range. The spectrometer sweeps through the spectroscopic region plotting resonances (absorption peaks) on a chart recorder (cf. dispersion IR spectrometers). CW spectrometers are usually dedicated to observation of a specific nucleus such as 1H.
- Fourier transform (FT) spectrometers, using superconducting magnets containing liquid nitrogen and liquid helium for cooling. Here the magnetic field is held constant and the sample is irradiated with a radio frequency pulse containing all the radio frequencies over the chemical shift region of the nucleus being examined, cf. FT -IR. Computer control allows rapid repeat scans to accumulate spectra, presenting the data as a standard CW-type spectrum via FT processing. Simple variation of the radio frequencies permits observation of different nuclei (multinuclear NMR spectrometers). Thus an FT-NMR spectrometer can be used for obtaining 1H, 13C, 19F, 15N and 31P NMR spectra.
The majority of NMR spectra are obtained from samples in solution and therefore the solvent should preferably not contain atoms of the nuclei being observed (except in the case of 13C-NMR). The most common solvents are those in which the hydrogen atoms have been replaced by deuterium, which is not observed under the conditions under which the spectrum is obtained. CDCl3 (deuteriochloroform, chloroform-d) is often the solvent of choice, but others such as dimethylsulphoxide-d6, [(CD3)SO], propanone-d6 [(CD3)CO], methanol-d4 (CD3OD) and deuterium oxide (D2O) are in common use.
As it is unlikely that you will be allowed 'hands-on' use of an NMR spectrometer, the best approach you can take to obtain a good spectrum is to ensure good sample preparation. The quality of an NMR spectrum is degraded by:
- inappropriate solvent;
- inappropriate concentration of solute;
- inappropriate solvent volume;
- solid particles in the solution;
- water in the sample (inefficient drying);
- paramagnetic compounds.
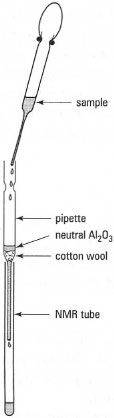 |
| Fig.29.4 Filtration of solutions for NMR. |
Interpreting NMR spectra
As a matter of routine in your laboratory work you will be required to interpret 1H-NMR spectra (also known as proton spectra). 13C-NMR spectra are becoming more common, while 19F and 31P spectra may be obtained in specialized experiments. Therefore you should concentrate on the interpretation of 1H and 13C spectra in the first instance.
Support our developers


