High-performance liquid chromatography
High-performance liquid chromatography (HPLC) uses high pressure to force the mobile phase through a closed column packed with micro metresized particles. This allows rapid separation of complex mixtures. Several operating modes of HPLC are possible. These are:- Normal phase (NPHPLC): the sample should be soluble in a hydrophobic solvent, e.g. hexane, and should be non-ionic. The mobile phase is non-polar while the stationary phase is polar, e.g. silica, cyano, ammo.
- Reversed phase (RPHPLC): the sample should be soluble in water or a polar organic solvent, e.g. methanol, and should be non-ionic. The mobile phase is polar while the stationary phase is non-polar, e.g. C18 (ODS), C8 (octyl), phenyl.
- Size exclusion chromotography (SEC): this is used when the major difference between compounds in a mixture is their molecular weight. It is normally used for compounds with molecular weights greater than 2000. The mobile phase should be a strong solvent for the sample. Aqueous SEC is called gel filtration chromatography (GFC) and is used for separation of proteins and other biomolecules, while organic SEC is called gel permeation chromatography (GPC) and is used for the separation of polymers.
- Ion exchange chromotography (1EC): it is used when compounds are ionic, or potentially ionic, e.g. anions, cations, organic acids and bases, amino acids, catecholamines, peptides. The mobile phase is typically a buffer and the choice of pH is critical. Two types can be differentiated: SAX (strong-anion exchange) and SCX (strong-cation exchange).
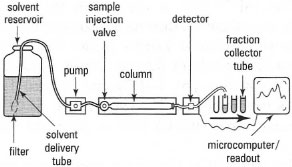 |
| Fig. 32.16 Components of an HPLC system. |
Solvent delivery system
This should fulfil certain requirements:
- It should be chemically inert.
- It should be capable of delivering a wide flow-rate range.
- It should be able to withstand high pressures.
- It should be able to deliver high flow-rate precision.
- It should have a low internal volume.
- It should provide minimum flow pulsation.
- Isocratic separation: a single solvent (or solvent mixture) is used throughout the analysis.
- Gradient elution separation: the composition of the mobile phase is altered using a microprocessor-controlled gradient programmer, which mixes appropriate amounts of two different solvents to produce the required gradient.
Sample introduction
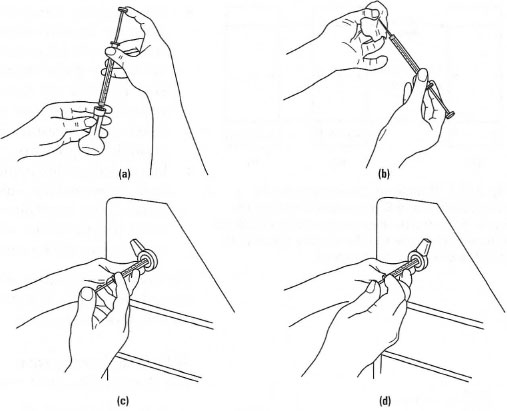
The most common method of sample introduction in HPLC is via a rotary valve, e.g. a Rheodyne® valve. A schematic diagram of a rotary valve is shown in Fig. 32.17. In the load position, the sample is introduced via a syringe to fill an external loop of volume 5, 10 or 20 µL. While this occurs, the mobile phase passes through the valve to the column. In the inject position, the valve is rotated so that the mobile phase is diverted through the sample loop, thereby introducing a reproducible volume of the sample into the mobile phase. The procedure for injection of a sample is shown in Fig. 32.18. In Fig. 32.18a the syringe is filled with the sample/standard solution (typically 1mL). Then the outside of the syringe is wiped clean with a tissue (Fig. 32.18b). The syringe is placed into the Rheodyne® injector of the chromatograph while in the 'load' position (Fig. 32.l8c) and the plunger on the syringe is depressed to fill the sample loop. Finally, the position of the Rheodyne'f valve is switched to the 'inject' position to introduce the sample into the chromatograph (Fig. 32.l8d) and then the syringe is removed from the injection valve. The procedure for the preparation of a series of calibration solutions is shown in Box 32.1.
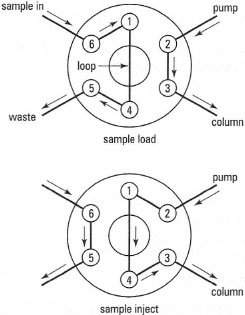 |
| Fig. 32.17 Schematic diagram of a rotary valve. |
 |
| Fig. 32.18 Sample injection in HPLC. |
The column
This is usually made of stainless steel, and all components, valves, etc., are manufactured from materials which can withstand the high pressures involved. The most common form of liquid chromatography is reversed phase HPLC. In RPHPLC the most common column packing material consists of C18 or octadecylsilane (ODS). A chemically bonded stationary phase is shown in Fig. 32.19. However, some of the surface silanol groups remain unaffected. These unreacted groups lead to undesirable chromatographic effects, such as peak tailing. One approach to remove the unreacted silanol groups is end capping. In this way, the silanol group is reacted with a small silylating group, e.g. trimethylchlorosilane. An alternative approach to nullify the action of the silanol groups is to add triethylamine to the mobile phase, which modifies the silica surface while in use.
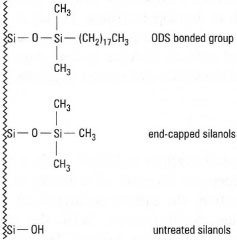 |
| Fig. 32.19 A C18 stationary phase. |
HPLC detectors
Most HPLC systems are linked to a continuous monitoring detector of high sensitivity, e.g. phenols may be detected spectrophotometrically by monitoring the absorbance of the eluent at 280 nm as it passes through a flow cell. Other detectors can be used to measure changes in fluorescence, current or potential, as described below. Most detection systems are non-destructive, which means that you can collect eluent with an automatic fraction collector for further study.
UV/visible detectors are widely used and have the advantages of versatility, sensitivity and stability. Such detectors are of two types: fixed wavelength and variable wavelength. Fixed-wavelength detectors are simple to use, with low operating costs. They usually contain a mercury lamp as a light source, emitting at several wavelengths between 254 nm and 578 nm; a particular wavelength is selected using suitable cutoff filters. The most frequently used wavelengths for analysis of organic molecules are 254 nm and 280 nm. Variable wavelength detectors use a deuterium lamp and a continuously adjustable monochromator for wavelengths of 190-600 nm. For both types of detector, sensitivity is in the absorbance range 0.00 1-1.0 (down to ≈ 1 ng), with noise levels as low as 4 × 10⁻⁵. Note that sensitivity is partly influenced by the path length of the flow cell (typically 10 mm), see Fig. 32.20. Monitoring at shortwavelength UV (e.g. below 240 nm) may give increased sensitivity but decreased specificity, since many organic molecules absorb in this range. Additional problems with short-wavelength UV detection include instrument instability, giving a variable base line, and absorption by components of the mobile phase (e.g. organic solvents, which often absorb at < 210 nm).
An important development in chromatographic monitoring is diode array detection (DAD). The incident light comprises the whole spectrum of light from the source, which is passed through a diffraction grating and the diffracted light detected by an array of photodiodes. Typical DAD can measure the absorbance of each sample component at 1-lOnm intervals over the range 190-600nm. This gives an absorbance spectrum for each eluting substance which may be used to identify the compound and give some indication as to its purity. An example of a three-dimensional diode array spectrum is shown in Fig. 32.21.
Many aromatic organic molecules, including some polycyclic aromatic hydrocarbons, show natural fluorescence (Table 26.1), or can be made to fluoresce by pre-colurnn or post-column derivatization with a fluorophore. Fluorescence detection is more sensitive than UV/visible detection, and may allow analysis in the picogram (10−12 g) range. A fluorescence detector consists of a light source (e.g. a xenon lamp), a diffraction grating to supply light at the excitation wavelength, and a photomultiplier to monitor the emitted light (usually arranged to be at right angles to the excitation beam). The use of instruments with a laser light source can give an extremely narrow excitation waveband, and increased sensitivity and specificity.
Electrochemical detectors offer very high sensitivity and specificity, with the possibility of detection of femtogram amounts of electroactive compounds such as catecholamines, vitamins, thiols, purines, ascorbate and uric acid. The two main types of detector, amperometric and coulometric, operate on similar principles, i.e. by measuring the change in current or potential as sample components pass between two electrodes within the flow cell. One of these electrodes acts as a reference (or counter) electrode (e.g. calomel electrode), while the other - the working electrode - is held at a voltage that is high enough to cause either oxidation or reduction of sample molecules. In the oxidative mode, the working electrode is usually glassy carbon, while in reductive mode a mercury electrode is used. In either case, a current flow between the electrodes is induced and detected.
Mass spectrometry used in conjunction with chromatographic methods can provide a powerful tool for identifying the components of complex mixtures, e.g. pharmaceuticals. One drawback is the limited capacity of the mass spectrometer - due to its vacuum requirements - compared with the volume of material leaving the chromatography column. Similarly, in HPLC, devices have been developed for solving the problem of large solvent volumes, e.g. by splitting the eluent from the column so only a small fraction reaches the mass spectrometer.
The computer-generated outputs from the mass spectrometer are similar to chromatograms obtained from other methods, and show peaks corresponding to the elution of particular components. However, it is then possible to select an individual peak and obtain a mass spectrum for the component in that peak to aid in its identification. This has helped to identify hundreds of components present in a single sample, including flavour molecules in food, drug metabolites and water pollutants.
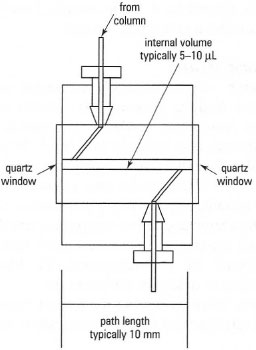 |
| Fig. 32.20 UV detector cell for HPLC. |
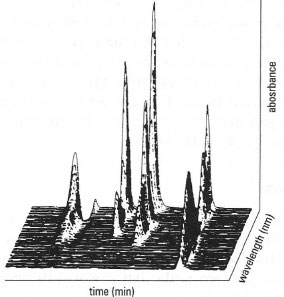 |
| Fig. 32.21 Diode array detector absorption spectra of the eluent from an HPLC separation of a mixture of four steroids, taken every 15 seconds. |
Recording and interpreting chromatograms
For analytical purposes, the detector output is usually connected to a computer-based data acquisition and analysis system. This consists of a personal computer (PC) with data acquisition hardware to convert an analogue detector signal to digital format, plus software to control the data acquisition process, store the signal information and display the resulting chromatogram. The software will also detect peaks and calculate their retention times and sizes (areas) for quantitative analysis. The software often incorporates functions to control the chromatographic equipment, enabling automatic operation. In sophisticated systems, the detector output may be compared with that from a 'library' of chromatograms for known compounds, to suggest possible identities of unknown sample peaks.
In simpler chromatographic systems, you may need to use a chart recorder for detector output. Two important settings must be considered before using a chart recorder:
- The base-line reading - this should be set only after a suitable quantity of mobile phase has passed through the column (prior to injection of the sample) and stability is established. The chart recorder is usually set a little above the edge of the chart paper grid, to allow for base-line drift.
- The detector range - this must be set to ensure that the largest peaks do not go off the top of the chart. Adjustment may be based on the expected quantity of analyte, or by a trial-and-error process. Use the maximum sensitivity that gives intact peaks. If peaks are still too large on the minimum sensitivity, you may need to reduce the amount of sample used, or prepare and analyse a diluted sample.
Support our developers


