The chromatogram
A plot of the detector response present at the column outlet as a function of time is called a chromatogram (Fig. 31.6). The time from injection of the sample until the peak elutes from the column is called the retention time, tr. The amount of compound present for a given peak can be quantified by measuring the peak height or area (most useful) and comparing it with the response for a known amount of the same compound.The aim of any chromatographic system is to resolve a number of components in a sample mixture, i.e. to ensure that individual peaks do not overlap or coincide. To achieve this you need to consider several important factors: capacity factor, separation factor or selectivity, column efficiency and asymmetry factor.
Capacity factor, k': This is a more useful measure of peak retention that retention time, as it is independent of column length and flow rate. To calculate k' you need to measure column dead time, to. This is the time it takes an unretained component to
![Peak characteristics in a chromatographic separation, Le. a chromatogram. For symbols, see eqns [31.1] and [31.3].](images/31.6.jpg) |
| Fig.31.6 Peak characteristics in a chromatographic separation, Le. a chromatogram. For symbols, see eqns [31.1] and [31.3]. |
| ⇒ Equation [31.1] |
|
Separation factor, α: The separation factor, or selectivity, identifies when the peaks elute relative to each other. It is defined for two peaks as the ratio of the capacity factors (k'2 > k'1):
| ⇒ Equation [31.2] |
|
where tr,1 and tr,2 are the retention times of peak 1 and peak 2, respectively. If two peaks are present the separation factor must be greater than one to achieve an effective separation.
Column efficiency (plate number), N: An additional parameter used to characterize a separation system is the plate number, N. It represents, in general terms, the narrowness of the peak and is often calculated as follows:
| ⇒ Equation [31.3] |
|
where tr is the retention time of the peak and w0.5 is its width at one-half of its height (Fig. 31.6).
For a compound emerging from a column of length L, the number of theoretical plates, N, can be expressed as:
| ⇒ Equation [31.4] | N = | L | |
| H |
where H is the plate height (or height equivalent to a theoretical plate). In general, chromatographic columns with larger values of N give the narrowest peaks and generally bftter separation.
Asymmetry factor, As: The plate number, N, assumes that the peak shape is Gaussian, but in practice this is rare. It is more likely that the peak is asymmetrical, i.e. it 'tails'. This is quantified using the asymmetry factor, As, calculated as shown Fig. 31.7.
A vertical line is drawn between the peak maximum and the base line. At 10% of the peak height, the width of the peak to the leading edge and the trailing edge is measuted (a and b in Fig. 31.7). The asymmetry factor is then calculated as follows:
| ⇒ Equation [31.5] | As = | b | |
| a |
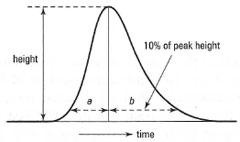 |
| Fig.31.7 Peak asymmetry. |
In general, As values between 0.9 and 1.2 are acceptable. If As > 1 peak tailing is in evidence; if As < 1 peak fronting is evident. The practical impact of peak tailing or fronting is that adjacent peaks are not as well separated as they would be if they were symmetrical, leading to difficulties in peak quantitation.
Support our developers


