Gas chromatography
In gas chromatography (GC), a gaseous solute (or the vapour from a volatile liquid) is carried by the gaseous mobile phase. In gas-liquid partition chromatography, the stationary phase is a non-volatile liquid coated on the inside of the column or on a fine support. In gas-solid adsorption chromatography, solid particles that adsorb the solute act as the stationary phase.The typical components of a gas chromatograph are shown in Fig. 32.1. A volatile liquid is injected through a septum into a heated port, which volatilizes the sample. A gaseous mobile phase carries the sample through the heated column, and the separated components are detected and recorded. Two types of columns are available: packed and capillary. Open tubular capillary columns offer higher resolution, shorter analysis time and greater sensitivity than packed columns, but have lower capacity for the sample.
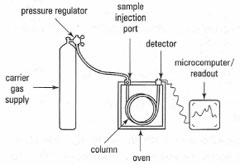 |
| Fig. 32.1 Components of a GC system. |
Sample injection
Samples are injected onto the 'top' of the column, through a sample injection port containing a gas-tight septum. The two common sample injection methods for capillary GC are:
- Split/splitless injector: in the split mode only a portion of the injected sample (typically, 1 part in 50) reaches the column. The rest is vented to waste. A split injector is used for concentrated samples (> 0.1 mgmL1 for FID). In the splitless mode all the sample volume injected passes through to the column. It is used, in this mode, for trace samples (< 0.1 mgmL1 for FID).
- Cold on-column injector: all the sample is injected onto the column. It is used for thermally unstable compounds and high-boiling solvents.
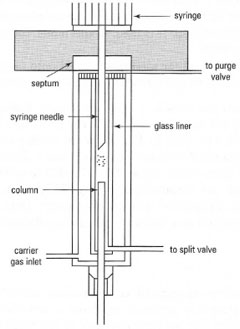 |
| Fig. 32.2 Sample introduction in GC: (a) split/splitless injector. |
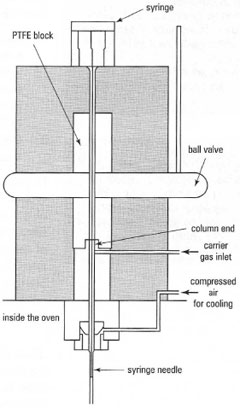 |
Fig. 32.2 Sample introduction in GC: (b) on-column injector. |
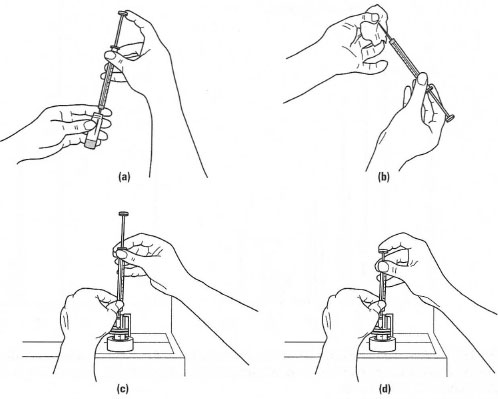 |
| Fig. 32.3 Sample injection in GC. (a) Fill the syringe, (b) wipe clean the outside of the syringe needle, (c) place the syringe needle into the injector and (d) depress the plunger on the syringe to inject the sample. |
The column
Modern GC uses capillary columns (internal diameter 0.1-0.5mm) up to 60m in length. The stationary phase is generally a cross-linked silicone polymer, coated as a thin film on the inner wall of the fused silica (SiO2) capillary: at normal operating temperatures, this behaves in a similar manner to a liquid film, but is far more robust. Common stationary phases for GC are shown in Fig. 32.4. The mobile phase ('carrier gas') is usually nitrogen or helium. Selective separation is achieved as a result of the differential partitioning of individual compounds between the carrier gas and silicone polymer phases. The separation of most organic molecules is influenced by the temperature of the column, which may be constant during the analysis ('isothermal' - usually 50-250°C) or, more commonly, may increase in a preprogrammed manner (e.g. from 50°C to 250°C at 10°C per minute).
Selecting an appropriate column for capillary GC is a difficult task and one which is usually left to the technician. However, it is important to be aware of some general issues and what influence they can have on the separation. The column internal diameter can affect both resolution and speed of analysis. Smaller internal diameters columns (0.25mm i.d.) can provide good resolution of early eluting peaks (Fig. 32.5a). However, the problem is that the analysis times of the eluting components may be longer and that the linear dynamic range may be restricted. In contrast, larger internal diameter columns (0.53 mm i.d.) provide less resolution for early eluting compounds (Fig. 32.5b), but this is reflected in shorter analysis times and a greater linear dynamic range. This type of column may provide sufficient resolution for the analysis of complex mixtures. Fig. 32.5 illustrates the effects of column internal diameter.
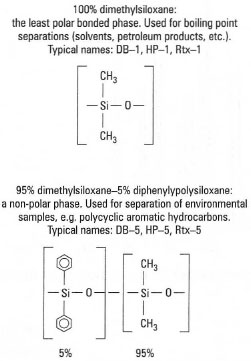 |
| Fig. 32.4 Common stationary phases for capillary GC. |
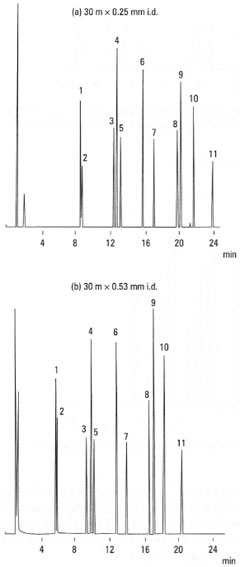 |
Fig. 32.5 Influence of GC column internal
diameter on separation: 1. phenol; 2. 2-
chlorophenol; 3. 2-nitrophenol; 4. 2,4-
dimethyl phenol; 5. 2,4-dichlorophenol; 6. 4-
chloro-3-methylphenol; 7. 2,4,6-trichlorophenol;
8. 2,4-dinitrophenol; 9. 4-nitrophenol; 10. 2-
methyl-4,6-dinitrophenol; 11.pentachlorophenol. |
Another important column effect is the length of the column and the influence this can have on the resolution of eluting components. It was previously shown that resolution was influenced by K', α and N. Substituting eqn [31.4] into eqn [31.6] produces the following equation:
| ⇒ Equation [32.3] | R = | 1 | √ | L | × | k' | × | α − 1 | |
| 4 | h | k' + 1 | α |
The importance of this equation can be shown by considering the influence on resolution, R, of column length, L. Under isothermal analysis conditions, i.e. the same column temperature, the retention of eluting compounds is more dependent upon column length. For example, doubling the column length doubles the analysis times and increases the resolution by 41%. This is shown in Fig. 32.6 for the analysis of phenols. In contrast, under temperatureprogrammed analysis, e.g. 130°C to 250°C at 4°C/min−1, the retention time of eluting components is more dependent on temperature. For example, doubling the column length has minimal effect on analysis times. This is shown in Fig. 32.7 for the analysis of bacterial acid methyl esters.
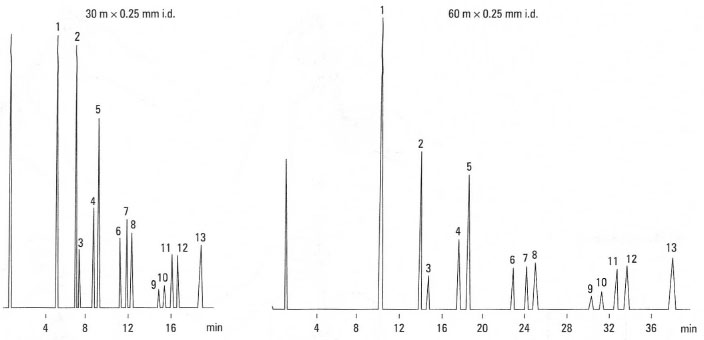 |
Fig.32.6 Influence of column length on analysis time. Analysis of phenols under isothermal conditions: 1. phenol; 2. a-cresol;
3.2,6-
xylenol; 4. p-cresol; 5. n-cresol; 6. a-ethylphenol; 7. 2,4-xylenol; 8. 2,5-xylenol; 9. 2,3-xylenol; 10. p-ethylphenol;
11. m-ethylphenol; 12.
3,5-xylenol; 13. 3,4-xylenol. |
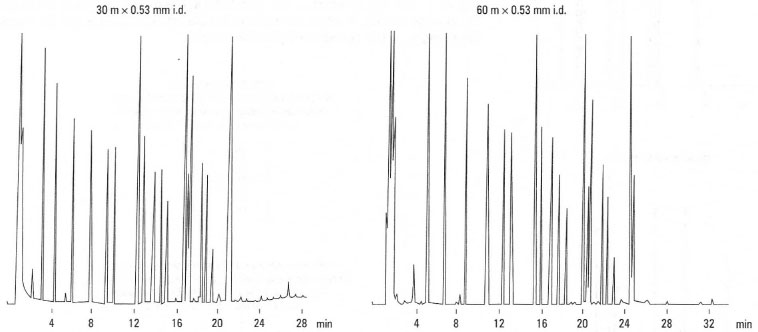 |
| Fig.32.7 Influence of column length on analysis time. Analysis of bacterial acid methyl esters under temperature-programmed conditions. |
GC detectors
The output from the GC column is monitored by a detector. The most commonly used detectors for GC analysis of organic molecules are as follows.
The flame ionization detector (FlD) is particularly useful for the analysis of a broad range of organic molecules. It involves passing the exit gas stream from the column through a hydrogen flame that has a potential of more than 100 V applied across it (Fig. 32.8). Most organic compounds, on passage through this flame, produce ions and electrons that create a small current across the electrodes, and this is amplified for measurement purposes. The FID is very sensitive (typically down to ≈ 0.1 pg), with a linear response over a wide concentration range. One drawback is that the sample is destroyed during analysis.
The thermal conductivity detector (TCD) is based on changes in the thermal conductivity of the gas stream brought about by the presence of separated sample molecules. The detector elements are two electrically heated platinum wires, one in a chamber through which only the carrier gas flows (the reference detector cell), and the other in a chamber that takes the gas flow from the column (the sample detector cell). In the presence of a constant gas flow, the temperature of the wires (and therefore their electrical resistance) is dependent on the thermal conductivity of the gas. Analytes in the gas stream are detected by temperature-dependent changes in resistance based on the thermal conductivity of each separated molecule; the size of the signal is directly related to concentration of the analyte.
The advantages of the TCD include its applicability to a wide range of organic and inorganic molecules and its non-destructive nature, since the sample can be collected for further study. Its major limitation is its low sensitivity (down to ≈ l0ng), compared with other systems.
The electron capture detector (ECD) is highly sensitive (Fig. 32.9) and is useful for the detection of certain compounds with electronegative functional groups, e.g. halogens, peroxides and quinones. The gas stream from the column passes over a β-emitter such as 63Ni, which provides electrons that cause ionization of the carrier gas (e.g. nitrogen). When carrier gas alone is passing the β-emitter, its ionization results in a constant current flowing between two electrodes placed in the gas flow. However, when electroncapturing sample molecules are present in the gas flow, a decrease in current is detected. An example of the application of the ECD is in detecting and quantifying chlorinated pesticides.
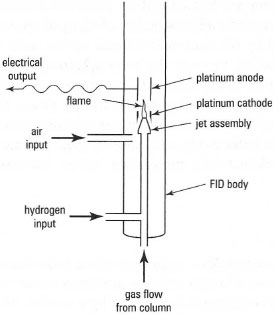 |
| Fig. 32.8 Components of a flame ionization detector (FID). |
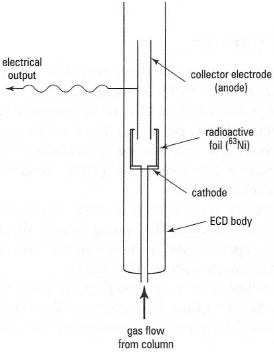 |
| Fig. 32.9 Components of an electron capture detector (ECD). |
Mass spectrometry used in conjunction with GC provides a powerful tool for identifying the components of complex mixtures, e.g. environmental pollutants, synthetic products, etc. (Fig. 32.10). The procedure requires computer control of the instrument and for data storage/analysis.
Compounds eluting from the column are bombarded by electrons (electron impact, El, mode) causing fragmentation and production of charged species. These charged species are separated by the mass spectrometer on the basis of their mass-to-charge ratio. Ions passing through the mass spectrometer are detected by an electron multiplier tube. The mass spectrometer can be used in two modes: total ion and selected ion monitoring. In the former mode, the
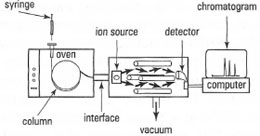 |
| Fig. 32.10 Schematic diagram of a GCMS instrument. |
Support our developers


