Infrared spectroscopy
In addition to ultraviolet-visible (UV-vis) spectroscopy, there are three other essential techniques that you will encounter during your laboratory course. They are:- Infrared (IR) spectroscopy: this is concerned with the energy changes involved in the stretching and bending of covalent bonds in molecules.
- Nuclear magnetic resonance (NMR) spectroscopy: this involves the absorption of energy by specific atomic nuclei in magnetic fields and is probably the most powerful tool available for the structural determination of molecules.
- Mass spectrometry (MS): this is based on the fragmentation of compounds into smaller units. The resulting positive ions are then separated according to their mass-ta-charge ratio (m/z).
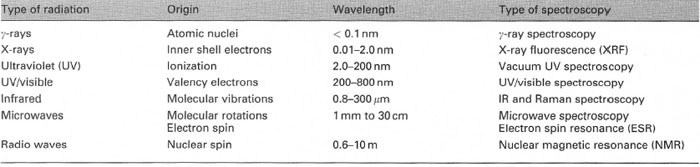 |
| Table 28.1 The electromagnetic spectrum and types of spectroscopy |
Infrared spectroscopy
A covalent bond between two atoms can be crudely modelled as a spring connecting two masses and the frequency of vibration of the spring is defined by Hooke's law (eqn [28.1]), which relates the frequency of the vibration (ν) to the strength of the spring, expressed as the force constant (k), and to the masses (m1 × m2) on the ends of the spring (defined as the reduced mass µ = (m1 × m2) ÷ (m1 + m2)).
⇒ Equation [28.1]
| ν = | 1 | √ | k | |
| 2π | µ |
In simple terms, this means that:
- the stretching vibration of a bond between two atoms will increase in
frequency (energy) if on changing from a single bond to a double bond
and then to a triple bond between the same two atoms (masses), i.e. the
spring gets stronger. For example,
ν for C ≡ C > ν for C = C > ν for C − C - as the masses of the atoms on a bond increases, the frequency of the
vibration decreases, i.e the effect of reducing the magnitude of µ for
example,
ν for C − H > ν for C − C; ν for C − H > ν for C − D; ν for O − H > ν for S − H
Since bonds between specific atoms have particular frequencies of vibration, IR spectroscopy provides a means of identifying the type of bonds in a molecule, e.g. all alcohols will have an O-H stretching frequency and all compounds containing a carbonyl group will have a C=O stretching frequency. This property, which does not rely on chemical tests, is extremely useful in diagnosing the functional groups within a covalent molecule.
IR spectra
A typical IR spectrum is shown in Fig. 28.1 and you should note the following points:
- The x-axis, the wavelength of the radiation, is given in wavenumbers (ν)
and expressed in reciprocal centimetres (cm−1). You may still see some
spectra from old instruments using microns (µ, equivalent to the SI unit
'micrometres', µm, at 1 × 10⁻⁶ m) for wavelength; the conversion is given
by eqn [28.2]:
⇒ Equation [28.2] wavenumber (cm−1) = l/wavelength (cm) = l0,000/wavelength (µm) - The y-axis, expressing the amount of radiation absorbed by the molecule, is usually shown as % transmittance. When no radiation is absorbed (all is transmitted through the sample) we have 100% transmittance and 0% transmittance implies all radiation is absorbed at a particular wavenumber. Since the y-axis scale goes from 0 to 100% transmittance, the absorption peaks are displayed down from the 100% line; this is opposite to most other common spectra.
- The cells holding the sample usually display imperfections and are not
completely transparent to IR radiation, even when empty. Therefore the
base line of the spectrum is rarely set on 100% transmittance and
quantitative applications of IR spectroscopy are more complex than forUV-vis.
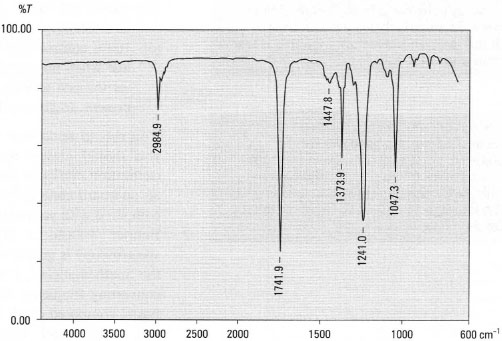
Fig. 28.1 IR spectrum of ethyl ethanoate CH3COOCH2CH3 as a liquid film.
IR spectrometers
There are two general types:
- Double-beam or dispersive instruments in which the IR radiation from a
single source is split into two identical beams. One beam passes through
the sample and the other is used as a reference and passes through air or
the pure solvent used to dissolve the sample. The difference in intensity
of the two beams is detected and recorded as a peak; the principal
components of this type of instrument are shown in Fig. 28.2. The
important controls on the spectrometer are:
- scan speed: this is the rate at which the chart moves - slower for greater accuracy and sharp peaks;
- wavelength range: the full spectrum or a part of the IR range may be selected;
- 100% control: this is used to set the pen at the 100% transmittance line when no sample is present the base line. It is usual practice to set the pen at 90% transmittance at 4000 cm−1 when the sample is present, to give peaks of the maximum deflection.
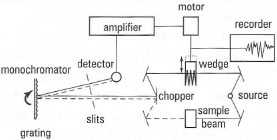
Fig. 28.2 Schematic diagram of a doublebeam IR spectrometer.
You should remember that this is an electromechanical instrument and you should always make sure that you align the chart against the calibration marks on the chart holder. In the more advanced instruments an on-board computer stores a library of standard spectra, which can be compared with your experimental spectrum. - F ourier transform IR (FT -IR) spectrometer: the value of IR
spectroscopy is greatly enhanced by Fourier transformation, named after
the mathematician J.B. Fourier. The FT is a procedure for interconverting
frequency functions and time or distance functions. The IR
beam, composed of all the frequencies in the IR range, is passed through
the sample and generates interference patterns, which are then
transformed electronically into a normal IR spectrum. The advantages of
FT-IR are:
- rapid scanning speed - typically four scans can be made per minute, allowing addition of the separate scans to enhance the signal-tonoise ratio and improve the resolution of the spectrum;
- simplicity of operation - the reference is scanned first, stored and then subtracted from the sample spectrum;
- enhanced sensitivity: the facility of spectrum addition from multiple scans permits detection of smaller quantities of chemicals;
- the integral computer system enables the use of libraries of spectra and simplifies spectrum manipulation, such as the subtraction of contaminant or solvent spectra.
Sample handling
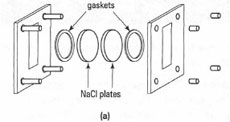
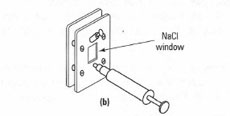
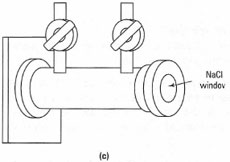
You can obtain IR spectra of solids, liquids and gases by use of the appropriate sample cell (sample holder). The sample holder must be completely transparent to IR radiation; consequently glass and plastic cells cannot be used. The most common sample cells you will encounter are made from sodium chloride or potassium bromide and you cannot use aqueous solutions or very wet samples, otherwise the sample cells will dissolve. A typical range of sample cells is shown in Fig. 28.3 and for routine qualitative work you will regularly use NaCI plates and KBr disks to obtain spectra of solids and liquids. Solution cells and gas cells are utilized in more specialized applications and require specific instructions and training.
|
|||||
| Fig. 28.3 Cells for IR spectroscopy: (a) demountable cell for liquid and solid films and mulls; (b) solution cell; (c) gas cell. |
Liquid samples
The most convenient way to obtain the IR spectrum of a pure, dry liquid is to make a thin liquid film between two NaCl disks (plates). Since the film thickness is unknown, this procedure is not applicable to quantitative work.
Solid samples If you were to place a fine powder between two NaCI plates, a usable spectrum would not be obtained because the IR radiation would be scattered by diffraction at the edges of the particles and would not pass through to the detector. There are three solutions to this problem:
- Mulls: in which the finely ground solid is mixed with a liquid, usually Nujol® (liquid paraffin) or, less frequently, HCB (hexachloro-1,3- butadiene). This mulling liquid does not dissolve the chemical but fills the gaps round the edges of the crystals preventing diffraction and scattering of the IR radiation. Remember that these mulling liquids have their own IR spectrum, which is relatively simple, and can be subtracted either 'mentally' or by the computer. The choice of mulling liquid depends upon the region of the IR spectrum of interest: Nujol® is a simple hydrocarbon containing only C-H and C-C bonds, whereas HCB has no C-H bonds, but has C-Cl, C=C and C-C bonds. Examination of the separate spectra of your unknown compound in each of these mulling agents enables the full spectrum to be analysed.
- KBr disks: here the finely ground solid compound is mixed with anhydrous KBr and squeezed under pressure. The KBr becomes fluid and forms a disk containing the solid compound dispersed evenly within it and suitable for obtaining a spectrum. The advantage of the KBr disk technique is the absence of the spectrum from the mulling liquid, but the disadvantages are the equipment required (Fig. 28.4) and the practice required to obtain suitable transparent disks, which are very delicate and rapidly absorb atmospheric moisture.
- Thin solid films: here a dilute solution of the compound in a low-boilingpoint solvent such as dichloromethane or ether is allowed to evaporate on a NaCI plate producing a thin transparent film. This method gives excellent results but is slightly limited by solubility factors.
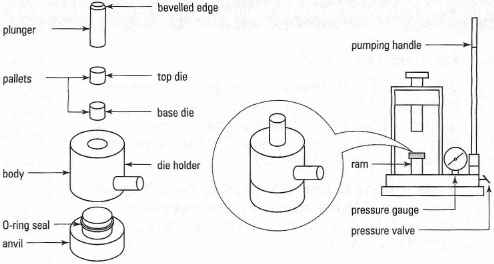 |
| Fig.28.4 Equipment for preparation of a KBr disk. |
Interpretation of IR spectra
To identify compounds from their IR spectrum you should know at which frequencies the stretching and bending vibrations occur. A detailed analysis can be achieved using the correlation tables found in specialist textbooks. For interpretation, the spectrum is divided into three regions.
| Region 1 | (4000-2000 cm−1): this region contains the high frequency vibrations such as C-H, N-H and O-H stretching, together with C=C and C≡N stretching vibrations. |
| Region 2 | (2000-1500 cm−1): this is known as the 'functional group region' and includes the stretching frequencies for C=C, C=O, C=N, N=O and N-H bending vibrations. |
| Region 3 | (1500-650 cm−1): this region contains stretching bands for C-O, CN, C-Hal and the C-H bending vibrations. It is known as the 'fingerprint region' because it also contains complex low-energy vibrations resulting from the overall molecular structure and these are unique to each different molecule. Fig. 28.5 shows the spectra of l-propanol and l-butanol, both of which show almost identical peaks for the O-H, C-H and C-O stretching frequencies and the C-H bending frequencies, but the spectra are different in the number and intensity of the peaks between 1500 and 650 crn−1, resulting from the presence of the additional CH2 in l-butanol, Conversely, these highly specific bands in the 'fingerprint' region are useful for identification of molecules by comparison with authentic spectra via a database. |
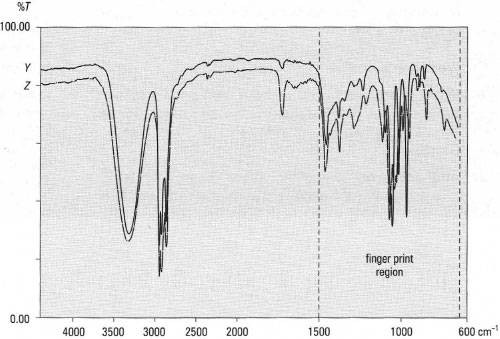 |
| Fig.28.5 IR spectra of l-propanol (Y) and l-butanol (Z). |
A simple correlation chart indicating the three regions of the spectrum and their associated bond vibrations is shown in Fig. 28.6. You can obtain most diagnostic information from spectral regions 1 and 2, since these are the simplest regions containing the peaks related to specific functional groups, while region 3 is normally used for confirmation of your findings. Another important aspect of the IR spectrum is the relative intensities of the commonly found peaks and you should become familiar with peak sizes. A chart indicating the positions, general shapes and relative intensities of commonly found peaks is shown in Fig. 28.7. When you are attempting to interpret an IR spectrum you should use the approach described in Box 28.4.
If you are studying complexes formed from metals and organic ligands, the metal-ligand stretching vibration will occur below 600 cm−1 and special IR spectrometers are used to observe this region. However, changes in the IR spectrum of the organic ligand on complexation can be detected in the normal 4000-650 cm−1 range.
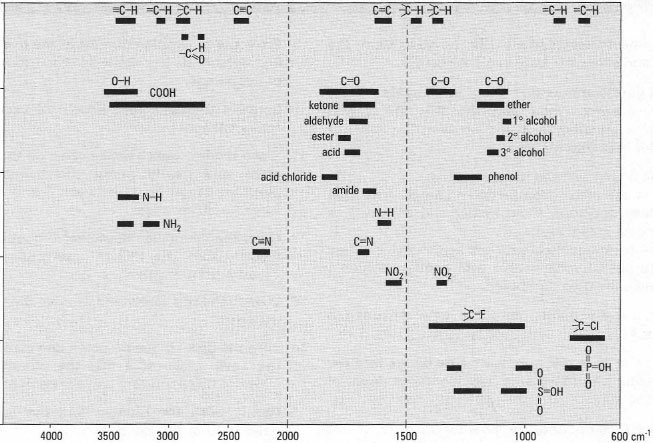 |
| Fig.28.6 Simplified correlation chart of functional group absorptions. |
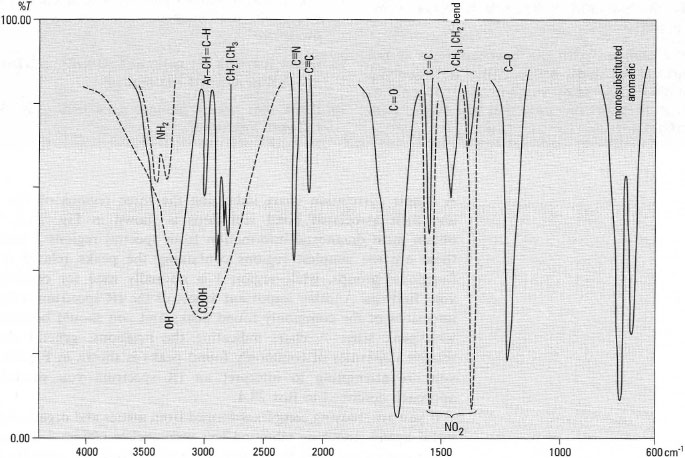 |
| Fig.28.7 Idealized intensities of some IR bands of common functional groups. |
Support our developers


