Mass spectrometry
Mass spectrometry (MS) involves the bombardment of molecules, in the gas phase, with electrons. An electron is lost from the molecule to give a cation, the molecular ion (M+), which then breaks down in characteristic ways to give smaller fragments, which are cations, neutral molecules and uncharged radicals (Fig. 30.1).The mixture of molecular ion and fragments is accelerated to specific velocities using an electric field and then separated on the basis of their different masses by deflection in a magnetic or electrostatic field. Only the cations are detected and a mass spectrum is a plot of mass-to-charge ratio (m/z) on the x-axis against the number of ions (relative abundance, RA, %) on the y-axis. A schematic of the components of a mass spectrometer is shown in Fig. 30.2 and an example of a line-graph-type mass spectrum in Fig. 30.3.
There are many types of mass spectrometer, from high-resolution doublefocusing instruments, which can distinguish molecular and fragment masses to six decimal places, to 'bench-top' machines with a quadrupole mass detector which can resolve masses up to about m/z = 500, but only in wholenumber differences. Routinely you are most likely to encounter data from 'bench-top' instruments and therefore only this type of spectrum will be considered.
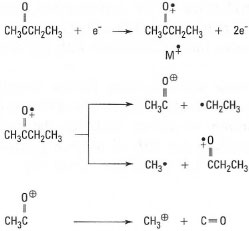 |
| Fig. 30.1 Formation and fragmentation of a molecular ion (M+). |
Sample handling
For low-resolution spectra obtainable from a 'bench-top' MS, samples should be presented in the same form and quantity as demanded for gas chromatographic analysis. For high-resolution spectra contamination of any sort must be avoided and samples (typically less than 500 µ.g) should be submitted in glass sample tubes with screwcaps containing an aluminiumfoil insert. MS is so sensitive that the plasticizers from plastic tubes or plastic push-on caps will be detected, as will contaminating grease from ground-glass joints and taps.
Mass spectra
The standard low-resolution mass spectrum (Fig. 30.3) is computer generated, which allows easy comparison with known spectra in a computer database for identification. The peak at the highest mass number is the molecular ion (M+), the mass of the molecule minus an electron. The peak at RA = 100%, the base peak, is the most abundant fragment in the spectrum and the computer automatically scales the spectrum to give the most abundant ion as 100%. The mass spectrum of a compound gives the following information about its chemical structure:
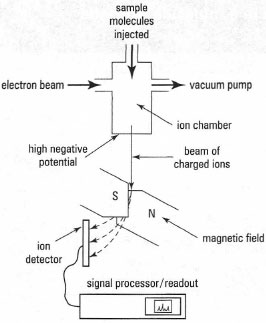 |
| Fig. 30.2 Components of an electron-impact mass spectrometer. |
- molecular ion mass, which includes information on the number of nitrogen atoms and the presence of chlorine and bromine atoms (see below), - which is not easily obtained from IR and NMR spectra;
- the most stable major fragment (base peak), which can be correlated to the structure of the molecule;
- other important fragment ions, which may give information on the structure; the detailed fragmentation pattern, which can be used to confirm a structure by reference to a library database, cf. the 'fingerprint' region in IR spectrometry.
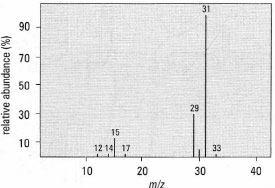 |
| Fig. 30.3 Mass spectrum for methanol; m/z = rnass-to-charqe ratio. |
Molecular ions
The m/z value of the molecular ion is the summation of all the atomic masses in the molecule, including the naturally occurring isotopes. For organic molecules you will find a small peak (M + 1) above the apparent molecular ion mass (M+) value due to the presence of 13C. The importance of isotope peaks is the detection of chlorine and bromine in molecules since these two elements have large natural abundances of isotopes, e.g. 35Cl:37Cl = 3: 1 and 79Br: 81Br = 1 : 1. The mass spectra produced by molecules containing these atoms are very distinctive with peaks at M + 2 and even M + 4 and M + 6 depending on how many chlorine or bromine atoms are present. The identification of the number and type of halogen atoms is illustrated in Box 30.1.
Since the low-resolution mass spectrum produces integer values for m/z, the mass of M+ indicates the number of nitrogen atoms in the molecule. If m/z for M+ is an odd integer, there is an odd number of N atoms in the molecule and, if the value is an even number, then there is an even number of N atoms. 40
Base peak
The molecular ion M+ fragments into cations, radicals, radical cations and neutral molecules of which only the positively charged species are detected. There are several possible fragmentations for each M+ but the base peak represents the most energetically favoured process with the m/z value of the base peak representing the mass of the most abundant (and therefore most stable) positively charged species. The fragmentation of M+ into the base peak follows the simplified rules outlined in Box 30.2, and for a more detailed interpretation you should consult the correlation tables to be found in the specialist texts referred to at the end of the section.
Fragmentation patterns
The mass spectrum of a molecule is unique and can be stored in a computer. A match of the spectrum with those in the computer library is made in terms of molecular weight and the 10 most abundant peaks and a selection of possibilities will be presented.
When you attempt to interpret the mass spectrum remember that:
- Only the base peak is almost certain to be derived from the molecular ion.
- Some lesser peaks may result from alternative fragmentation pathways, but these may be useful in assigning structural features.
- MS is often used to confirm information from IR and NMR spectra; interpretation of the mass spectrum alone is very difficult, except for the simplest molecules.
Support our developers


